 MetaTrader 5
 Experts
 Indicators
 Scripts
 Libraries
 Storage
Watch how to download trading robots for free
Find us on Twitter!
Join our fan page
Join our fan page
You liked the script? Try it in the MetaTrader 5 terminal

Gold Weekend Gap Map (XAUUSD): gap size in ADR and fill time - indicator for MetaTrader 5

- Views:
- 14
- Rating:
- Published:
-
 You are missing trading opportunities:
- Free trading apps
- Over 8,000 signals for copying
- Economic news for exploring financial markets
Registration Log inYou agree to website policy and terms of use
If you do not have an account, please register -
 Need a robot or indicator based on this code? Order it on Freelance
Go to Freelance

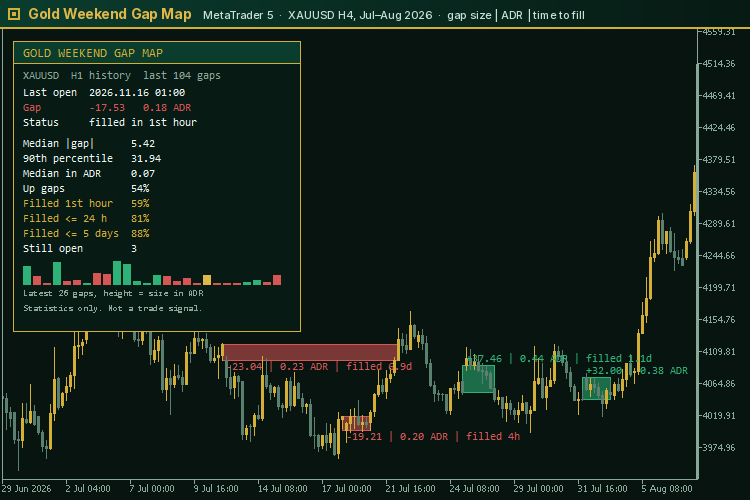
Gold Weekend Gap Map is a MetaTrader 5 indicator for XAUUSD and any other symbol that closes for the weekend. When the market reopens, the first price is often not Friday's close. This indicator finds each of those openings in the H1 history, draws the gap as a zone from Friday's close to the new open, and answers three practical questions: how large was it compared with a normal day, was it filled, and how long did that take.
It does not place, modify or close orders, and it is not a trade signal.
Features
- Gap zones on the chart: green for an up gap, red for a down gap. A zone runs from the last bar before the pause until the bar that traded back to Friday's close, so its width shows how long the gap stayed open.
- A label next to each gap: size in price, size in ADR, and fill time, for example +37.46 | 0.44 ADR | filled 1.1d . An unfilled gap is labelled OPEN , and a dashed gold line marks Friday's close as the price that would fill it.
- Panel with the latest opening: time, size, size in ADR, and status (filled, or the distance left to Friday's close).
- Statistics for the last N gaps (104 by default, about two years of weeks): median and 90th percentile of the gap size, median size in ADR, share of up gaps, and the share filled in the first hour, within 24 hours and within N trading days.
- Mini chart of the latest 26 gaps: bar height is the size in ADR, colour is the direction, gold means still open.
- Optional alert when a week opens with a gap larger than a chosen share of ADR (0.20 by default), with an optional push notification.
- Objects use the prefix GWGM_ and are removed with the indicator.
How it measures
- A gap is the open of the first H1 bar after a pause in quotes of at least 36 hours, minus the close of the last bar before the pause. By default only openings on Sunday or Monday are counted, so it is a weekend tool; long holiday closures that end on those days are included.
- ADR is the average high–low range of the 14 daily bars completed before the gap. The gap divided by ADR is easier to compare across years than dollars, because gold at 4,000 moves more dollars than gold at 1,300.
- A gap is filled when a later H1 bar trades back to Friday's close, including the opening bar itself. "First hour" means the opening H1 bar already reached it.
- In the fill table, a gap that is still open and younger than the window is left out of that window, so a fresh gap does not lower the rate before it has had time.
Everything is computed from completed history plus the forming bar for the fill check. A fill that has happened is never undone, so past labels do not change.
What it shows on XAUUSD
On one broker server (FreshForex-MT5), 509 week openings from January 2017 to 16 November 2026 gave these figures (measured with the same rules on H1 bars):
| Gap size (share of ADR) | Gaps | Filled in 1st hour | Within 24 h | Within 5 trading days |
|---|---|---|---|---|
| under 0.05 | 272 | 83% | 97% | 98% |
| 0.05 – 0.10 | 107 | 67% | 90% | 95% |
| 0.10 – 0.25 | 85 | 39% | 81% | 89% |
| over 0.25 | 43 | 2% | 42% | 70% |
Small gaps were usually closed within the first hour. Large gaps were not: fewer than half of the gaps above a quarter of ADR were filled within a day. "Gaps always fill" is not a rule you can rely on with gold. These are past data from one server, not a forecast; your broker's history may differ.
Inputs
| Input | Default | Meaning |
|---|---|---|
| Pause, hours | 36 | Minimum pause in quotes that counts as a gap. |
| Weekend only | true | Count only openings on Sunday or Monday. |
| ADR days | 14 | Completed daily bars in the ADR. |
| Statistics lookback | 104 | Number of latest gaps in the panel statistics. |
| Fill window, days | 5 | Longest fill window in the table, in trading days of 24 H1 bars. |
| Gaps drawn | 12 | Latest gaps drawn on the chart. |
| Labels / open target | on / on | Size and fill labels; dashed line at Friday's close while a gap is open. |
| Minimum zone width, hours | 24 | Keeps quickly filled gaps visible on higher timeframes. |
| Alert, threshold in ADR, push | off, 0.20, off | Alert at the weekly open for a large gap. |
| Panel, offsets, font, colours | Display settings. |
How to use it
- Attach it to XAUUSD on H1 or H4. The measurements always come from H1, whatever the chart timeframe.
- On Monday, look at the size in ADR, not only in dollars. A gap of 0.03 ADR and a gap of 0.4 ADR are different events.
- If your Expert Advisor holds positions over the weekend, check how often a gap of today's size stayed open for a day or more. That is the risk your stop may be filled away from its level.
- Do not treat an open gap as a target or a signal. It is a measurement of what happened.
Requirements
- MetaTrader 5, any symbol with a weekend break. Defaults are chosen for gold.
- H1 history for the lookback (about two years for 104 gaps) and D1 history for the ADR.
- No DLL, no WebRequest, no internet access. The indicator does not trade.
About the author
I also develop the Golden Sniper XAU Expert Advisor for MetaTrader 5. More free tools from the same author: https://www.mql5.com/en/users/krechet233
Gold Volatility and Risk Meter (XAUUSD): ATR regime and stop cost
Shows where today's daily ATR stands against the last 1, 3 and 5 years, and translates an ATR stop into money, lot size and minimum-lot risk for your account settings. Completed bars only. Display only, it does not trade.
Spread and Liquidity Clock: Time-of-Day Spread, Activity and Cost-to-Range Profile from Your Broker's History
Builds a time-of-day profile from your own broker's history: the typical spread, the typical tick activity and the typical spread-to-range cost of every time slot of the trading day. Cheap and expensive slots are marked in the indicator window, the daily rollover window is flagged, and a panel lists the best and worst slots and ranks the current spread against its own slot.
Accelerator Oscillator (AC)
The Acceleration/Deceleration Indicator (AC) measures acceleration and deceleration of the current driving force.
MACD Signals
Indicator edition for new platform.