 MetaTrader 5
 Experts
 Indicators
 Scripts
 Libraries
 Storage
Watch how to download trading robots for free
Find us on Twitter!
Join our fan page
Join our fan page
You liked the script? Try it in the MetaTrader 5 terminal

Spread and Liquidity Clock: Time-of-Day Spread, Activity and Cost-to-Range Profile from Your Broker's History - indicator for MetaTrader 5

- Views:
- 37
- Rating:
- Published:
-
 You are missing trading opportunities:
- Free trading apps
- Over 8,000 signals for copying
- Economic news for exploring financial markets
Registration Log inYou agree to website policy and terms of use
If you do not have an account, please register -
 Need a robot or indicator based on this code? Order it on Freelance
Go to Freelance

Spread and Liquidity Clock: Time-of-Day Spread, Activity and Cost-to-Range Profile from Your Broker's History
OVERVIEW
Most spread tools show the spread of the moment. The question a trader really asks is different: when is it cheap and liquid to trade this symbol on my broker, and is right now a good or a bad time? The answer depends on the broker, the symbol and the time of day, and it is already stored in your chart history: every bar carries a spread value, a tick volume and a price range. This indicator groups those values by time of day and shows what is normal for each slot.
For every time slot of the day (30 minutes by default, in server time) it keeps three medians:
- Typical spread, in points. The median is used, because rollover and news spikes would distort an average.
- Typical activity, the median tick volume of the bars in the slot. This is the number of price changes, not traded volume.
- Typical cost-to-range, the typical spread divided by the typical bar range, in percent. A low value means price moves a lot compared with what it costs to trade. A high value means you pay a lot for little movement.
The slots are then ranked against each other. The cheapest quarter of the slots is called cheap and the most expensive quarter is called expensive (the share is set by InpCutoffPercent ). A slot with the same typical spread as all the others, for example on a fixed-spread account, is never called cheap or expensive.
The profile is built without looking ahead. Each bar is judged against the profile of the bars that came before it, and a bar is added to the profile only once it is closed. The forming bar is therefore ranked against its slot, but it never counts itself. A slot with fewer than InpMinSamples bars stays empty until it has enough history. The calculation is incremental: on every call only the new bars and the bar that was still forming are processed, and the profile is stored in small fixed-size histograms, so history is never rescanned and nothing is sorted.
Two details of the numbers. Values from 0 to 127 are counted exactly. Larger values, such as the range of a bar in points, are grouped in bins about 4% wide, so those medians can be off by up to about 4%. A spread of 0 in the history means that the broker did not store one. Such a bar is left out of the spread statistics and is counted in the share of bars with a usable spread shown in the panel.
How to interpret it
- Histogram (indicator window). One bar per chart bar, whose height is the typical spread of that bar's time slot, in points. Dark gray: cheap slot. Light gray: normal slot. White: expensive slot. Because the same slots repeat every day, the histogram shows the daily pattern as a repeating comb. Bars of slots that do not have enough samples yet are empty.
- Dotted line. The spread recorded in each bar. Where the dotted line is far above the bars, the bar was more expensive than usual for its slot. Bars without a spread value are left out.
- Dots. Bars inside the rollover window. The window starts at InpRolloverHour (server time) and lasts InpRolloverMinutes . Spreads usually widen around the daily rollover, so these dots tell you that a jump is a known pattern and not noise. The dot sits on the spread of the bar.
- Dotted horizontal line. The median spread of the whole day, from all slots together. Slots below it are cheaper than the day as a whole.
- Data Window. "Typical spread / range (%)" is the cost-to-range of the slot. "Typical tick volume" is the activity of the slot. "Spread rank in slot (%)" is the percentage of earlier bars in the same slot that had a lower spread (equal spreads count half): 50 is a typical spread, 95 is among the most expensive 5% for that time of day.
- Panel (top left of the chart).
- Line 1: symbol, timeframe, slot length, profile (all weekdays, or the weekday of the newest bar).
- Line 2: number of days and bars in the profile, and the share of bars that have a usable spread. LOW appears if it is below 50%.
- Line 3: whole-day medians of the spread and of the bar range, and the cost-to-range.
- Lines 4 and 5: the three cheapest and the three most expensive slots by typical spread.
- Lines 6 and 7: the three slots with the lowest and with the highest cost-to-range.
- Line 8: the newest bar: its slot, its spread, its rank inside the slot, the typical spread and the class of the slot (cheap, normal or expensive).
- Line 9: the activity of the newest closed bar compared with the typical tick volume of its slot.
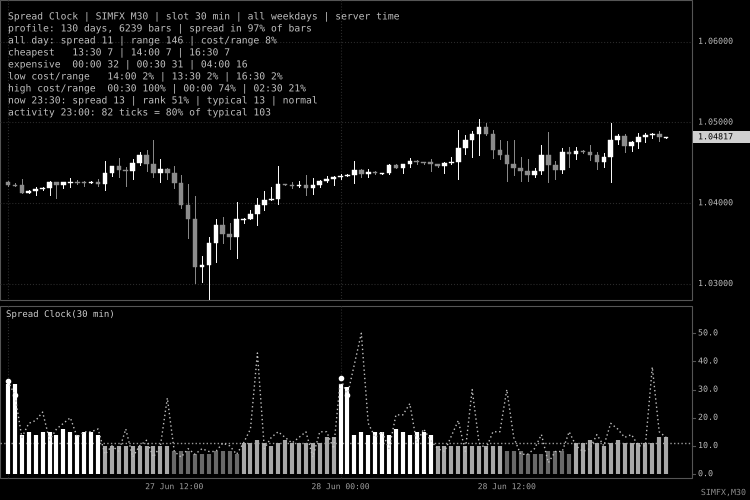
Fig. 1. Two days of M30 bars. The histogram shows the typical spread of each 30-minute slot (dark gray cheap, light gray normal, white expensive), the dotted line is the spread recorded in each bar, the white dots mark the rollover window, and the dotted horizontal line is the median spread of the whole day. The panel lists the cheapest and the most expensive slots and ranks the newest bar against its slot. Black and white screenshot, per the Code Base image guidelines.
External variables (inputs)
| Input | Default | Purpose |
|---|---|---|
| InpSlotMinutes | 30 | Length of a time slot in minutes (5-240). It is raised to the length of the chart bar, never below 5, and moved up to the next value that divides the day evenly (so 50 becomes 60). |
| InpWeekdaySplit | false | Keep a separate profile for each weekday (up to 7). Every slot then has about a fifth of the samples, so more history is needed. |
| InpMinSamples | 20 | Bars a slot needs before its values are used (5-500). With the weekday split a slot gets one bar per week, so 20 means about 20 weeks. |
| InpHistoryBars | 20000 | Newest bars used when the indicator loads or is fully recalculated. 0 uses all bars. New bars are added as they arrive. |
| InpCutoffPercent | 25 | Share of slots called cheap and share called expensive (5-45). 25 means the cheapest quarter and the most expensive quarter of the slots. |
| InpRolloverHour | 0 | Server hour at which the daily rollover window starts (0-23). -1 switches the marker off. |
| InpRolloverMinutes | 60 | Length of the rollover window in minutes (1-720). |
| InpShowPanel | true | Show the statistics panel. |
| InpCheapColor | clrDimGray | Histogram color of cheap slots. |
| InpNormalColor | clrDarkGray | Histogram color of normal slots. |
| InpExpensiveColor | clrWhite | Histogram color of expensive slots. |
| InpActualColor | clrSilver | Color of the dotted line with the spread of each bar. |
| InpTextColor | clrSilver | Panel text color. |
| InpFontSize | 8 | Panel font size (Consolas). The line height follows the size. |
| InpPanelX , InpPanelY | 8, 14 | Panel offset from the upper left corner of the chart, in pixels. |
Recommended use
- Timeframes. Any intraday timeframe from M1 to H4. On D1 and longer there is no time of day, and the indicator shows a message and draws nothing. M15 to H1 are a good choice: M1 bars have few ticks and a noisy range, and slots shorter than the chart bar are not possible.
- History. Check the "days" figure in the panel. A profile of a few weeks is still moving, and the first lists of cheap and expensive slots can change. 100 days or more is more stable. Use the weekday split only when you have a lot of history, and expect the Monday open and the Friday close to look different from midweek.
- Server time. All slots are in the time of the broker's server, not your local time. If the broker follows daylight saving time, a slot means a different real-world hour in summer and winter, and the profile mixes the two. Compare the slot times with the sessions of the market, not with your own clock.
- Spread data in the history. The spread stored in a historical bar is one value per bar, not an average over the bar, and a few brokers store 0 or a constant. Look at the usable share in line 2 of the panel. A constant spread gives a flat profile in which no slot is cheap or expensive, which is the correct result for a fixed-spread account.
- Costs that are not in the spread. The indicator measures the spread only. On accounts that charge a commission per lot (ECN, raw spread) the commission is not included.
- Tick volume. Activity means the number of price changes the broker's feed sent, not traded volume. It is a good relative measure of how busy a slot is on the same broker, and it cannot be compared between brokers.
- It describes the past. The profile tells you what was usual, not what will happen. A news release can widen the spread in a slot that is normally cheap, and the rank in line 8 shows when the spread of the moment is unusual for the slot.
- Cost-to-range. It is the typical spread divided by the typical range of the bar on the same timeframe, so it changes with the timeframe. Use it to compare slots of the same chart, not charts of different timeframes.
- Performance and memory. With the defaults the histograms use about 0.3 MB. With the weekday split and 5-minute slots they use up to about 11 MB. A loaded history is processed once, and later ticks only touch the newest bars and the panel.
- Chart objects. The only objects are the panel lines in the main chart window, named with the prefix SC_ . They are removed in OnDeinit() .
- Account types. The indicator does not trade and does not depend on netting or hedging accounts.
 Noise Band Momentum - intraday Nasdaq breakout of the noise area (Zarattini 2024 rules)
Intraday momentum EA for the Nasdaq 100: trades breakouts of a noise band around the New York open (rules of Zarattini, Aziz and Barbon, 2024), exits inside the band or across the session VWAP, flat at 16:00 New York.
Session Boxes with DST-correct clocks
Tokyo, London and New York session boxes with high-low range, kept on the right hours through every clock change, plus a live clock panel.
Accelerator Oscillator (AC)
The Acceleration/Deceleration Indicator (AC) measures acceleration and deceleration of the current driving force.
MACD Signals
Indicator edition for new platform.