 MetaTrader 5
 Experts
 Indicators
 Scripts
 Libraries
 Storage
Watch how to download trading robots for free
Find us on Twitter!
Join our fan page
Join our fan page
You liked the script? Try it in the MetaTrader 5 terminal

Gold Level Map (XAUUSD): Round Numbers, Prior Day/Week Extremes and ADR - indicator for MetaTrader 5

- Views:
- 26
- Published:
-
 You are missing trading opportunities:
- Free trading apps
- Over 8,000 signals for copying
- Economic news for exploring financial markets
Registration Log inYou agree to website policy and terms of use
If you do not have an account, please register -
 Need a robot or indicator based on this code? Order it on Freelance
Go to Freelance

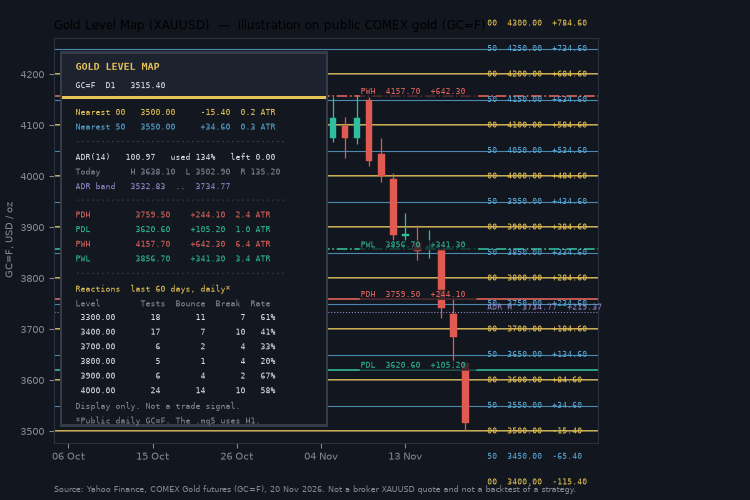
Gold Level Map is a MetaTrader 5 indicator for XAUUSD and any other symbol. It puts the prices most gold traders already watch onto one chart: round numbers, the previous day’s high and low, the previous week’s extremes, and how much of the average daily range has been used today. A compact dark panel shows the distance to each of those prices, in money and in H1 ATR. The indicator does not place, modify or close orders, and it is not a trade signal.
Features
- Colour-coded major and mid psychological levels (typically 100 and 50 on gold; the step is automatic on other symbols, or set it by hand). Optional minor levels stay off by default.
- Chart labels show the tag, the price and the distance from the last bid (for example 00 3500.00 -15.40 ).
- Prior extremes: previous day high and low (PDH / PDL), the current day open, previous week high and low (PWH / PWL). The week open and previous month are optional.
- ADR budget: average range of the last 14 completed daily bars, how much of it has been used today, and dotted projections at day-open ± ADR.
- Reaction table on closed H1 bars only: tests, bounces, breaks and the bounce rate for the nearest figures. Open episodes are listed in the logic, but excluded from the rate.
- Optional alerts when a closed bar first touches a major level, a mid level, or PDH/PDL. At most one alert per level per day.
- Dark-theme panel with auto-scale, configurable colours, fonts and widths. Objects use the prefix GLM_ and are removed when the indicator is removed.
- No repaint of historical signals: previous-period extremes use completed bars; reactions and alerts use closed bars. Today’s high, low and distances update naturally as the current day develops.
- Works on any symbol and any timeframe that has enough D1 and H1 history. Defaults are chosen for gold.
If a prior extreme lands on a round number, one line is kept and the label shows both names (for example PDH/00 3700.00 +27.60 ).
How the reaction statistics are decided
The table is a map of recent behaviour, not a forecast and not an edge claim.
- Only closed H1 bars are used. The current bar is ignored.
- A test starts when a closed H1 bar first trades through the level after the previous close was clearly on one side.
- The episode then waits up to N H1 bars (24 by default):
- Bounce — the close is back on the approach side by the buffer;
- Break — the close is through the level by the buffer;
- Open — the budget ran out. Open episodes are excluded from the bounce rate.
- The buffer is 0.20 × ATR(H1, 14) by default.
- The bounce rate is bounces / (bounces + breaks) over the lookback (60 days by default).
A rate near 50% is a normal result. It means the figure is a place people look at, not a promise that it will hold.
An illustration on public gold data
The screenshots use COMEX Gold futures (GC=F) daily bars from Yahoo Finance, 1 January 2023 to 20 November 2026, because broker XAUUSD ticks are not a public series. They illustrate the idea; they are not a Strategy Tester report and not a copy of your broker’s XAUUSD chart. The published .mq5 always reads the chart symbol and scores reactions on H1.
On that public daily sample, with a buffer of 0.20 × the median daily range (about $8.2):
- 29 hundred-levels with at least five tests: 421 tests, 222 bounces, 199 breaks, decided bounce rate 52.7%.
- 29 fifty-levels with at least five tests: 444 tests, bounce rate 50.0%.
Individual figures differ, and figures with only a handful of tests are noisy. That is why the rate is shown next to the raw counts.
Inputs
Round numbers
| Input | Default | Meaning |
|---|---|---|
| Major step | 0 (auto) | Auto uses a 1-2-5 step of about 2.5% of price (100 on gold, 0.01 on EURUSD, 1000 on BTC). |
| Levels each side | 4 | How many major figures are drawn above and below price. |
| Show mid / minor levels | mid on, minor off | Mid = half the major step; minor = one tenth. |
Prior extremes and ADR
| Input | Default | Meaning |
|---|---|---|
| PDH, PDL, day open, PWH, PWL | on | Previous highs and lows use completed periods only. |
| Week open, PMH, PML | off | Optional. |
| ADR lookback | 14 | Completed daily bars only. |
| Show ADR projections | on | Dotted lines at day open ± ADR. |
Reaction statistics and alerts
| Input | Default | Meaning |
|---|---|---|
| Lookback days | 60 | Window for the H1 reaction table. |
| Episode bars | 24 | Maximum H1 bars to wait for a bounce or a break. |
| Decision buffer, ATR | 0.20 | Size of the bounce/break filter, in H1 ATR. |
| Reaction rows | 6 | How many nearest figures the table shows. |
| Alerts | off | Closed-bar touches only; popup / push / sound. |
Display and colours
| Input | Default | Meaning |
|---|---|---|
| Show panel / show distance | on | Distance on chart labels can be switched off. |
| Auto-scale | on | Font and panel width follow the chart size. Base font size is still yours to set. |
| Panel corner, offsets, width | left upper, width 0 | Width 0 = auto. |
| Font, label shift, line widths | Consolas, shift 0 | Shift 0 = auto. |
| Colours | dark gold / teal palette | Every line, label and panel colour is an input. |
How to use it
- Attach the indicator to XAUUSD, or to any other symbol. H1, M15 and H4 are comfortable starting points.
- Read the nearest 00/50 and the leftover ADR before you plan a trade. If the day has already used more than 100% of ADR, a late entry has less “average” room left — that is a budget, not a barrier.
- Treat PDH, PDL, PWH and PWL as context, in the same way you would draw them by hand.
- Leave the alerts off until you have watched a few sessions, then enable only the levels you care about.
- Do not treat a high bounce rate as a buy or sell signal.
Requirements
- Platform: MetaTrader 5.
- Works on any symbol with enough bars on D1 and H1.
- No DLL calls, no WebRequest, no internet connection.
- The indicator does not trade.
About the author
More free tools by the same author: https://www.mql5.com/en/users/krechet233
 MT5 New-Bar and Connection Event Logger
A lightweight MetaTrader 5 Expert Advisor that records new-bar events and terminal connection-state changes to a local CSV file. Designed for developers and traders who need reliable event logging, diagnostics and monitoring without executing trades.
Gap and Weekend Map: Measuring Gap Fill Rate, Fill Time and Gap Size Relative to ATR
Marks every opening gap on the chart, measures its size in ATR units and follows it until price trades back to the fill level (previous close by default). A panel reports the fill rate, the median and 90th-percentile number of bars to fill, and the same figures for weekend gaps and for three gap-size buckets. Gaps that are still undecided are reported separately and never counted as filled.
Accelerator Oscillator (AC)
The Acceleration/Deceleration Indicator (AC) measures acceleration and deceleration of the current driving force.
MACD Signals
Indicator edition for new platform.