 MetaTrader 5
 Experts
 Indicators
 Scripts
 Libraries
 Storage
Watch how to download trading robots for free
Find us on Facebook!
Join our fan page
Join our fan page
You liked the script? Try it in the MetaTrader 5 terminal

MT5 New-Bar and Connection Event Logger - expert for MetaTrader 5
Savia Forex Software Solutions

I develop custom MetaTrader 5 Expert Advisors (trading robots), indicators, scripts and interconnected trading signal systems through Savia Forex Software Solutions.
- Views:
- 59
- Published:
-
 You are missing trading opportunities:
- Free trading apps
- Over 8,000 signals for copying
- Economic news for exploring financial markets
Registration Log inYou agree to website policy and terms of use
If you do not have an account, please register -
 Need a robot or indicator based on this code? Order it on Freelance
Go to Freelance
Overview
The MT5 New-Bar & Connection Event Logger is a lightweight diagnostic Expert Advisor developed by Savia Forex Software Solutions. It monitors newly observed chart bars and MetaTrader 5 terminal connection states, recording detected events in a local CSV file for subsequent inspection and analysis. The utility is intended for traders, MQL5 developers and system administrators who need greater visibility into trading-terminal activity, particularly when developing automated strategies, monitoring systems and signal-processing integrations. It does not open, modify or close trading positions.
Key Features
-
New-Bar Detection: Identifies newly observed bars on the monitored chart.
-
Connection Monitoring: Records observed terminal connectivity states and detected changes.
-
CSV Event Logging: Stores event records for review using Excel, other spreadsheet applications or custom analysis tools.
-
Duplicate Prevention: Avoids repeatedly recording the same observed bar during normal processing.
-
Lightweight Operation: Designed as a diagnostic utility without trading execution.
-
Development Support: Provides useful event information for testing Expert Advisors, indicators and automated monitoring workflows.
How It Works
When the Expert Advisor starts, it initializes its monitoring functionality and records the initial observed state.
During operation, it monitors chart activity and identifies newly observed bars. Relevant events are written to a CSV file, providing a chronological record that can assist with debugging and operational analysis.
The connection-monitoring component also tracks terminal connectivity information, allowing developers to investigate observed connection-state changes and related system behaviour.
The logger records events observed while it is operating. It does not reconstruct a complete historical record of events that occurred before activation or while the application was unavailable.
Installation and Usage
-
Download the attached MQL5 source file.
-
Open the file in MetaEditor 5.
-
Compile the Expert Advisor.
-
Open MetaTrader 5 and select the chart you wish to monitor.
-
Attach the New-Bar & Connection Event Logger to the chart.
-
Review any available settings under the Inputs tab.
-
Allow the utility to run while market data is being received.
-
Locate the generated CSV file and inspect the recorded events.
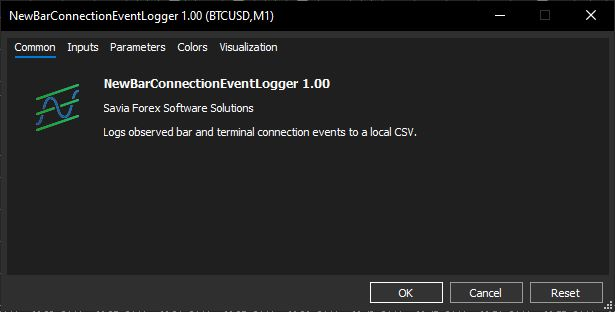
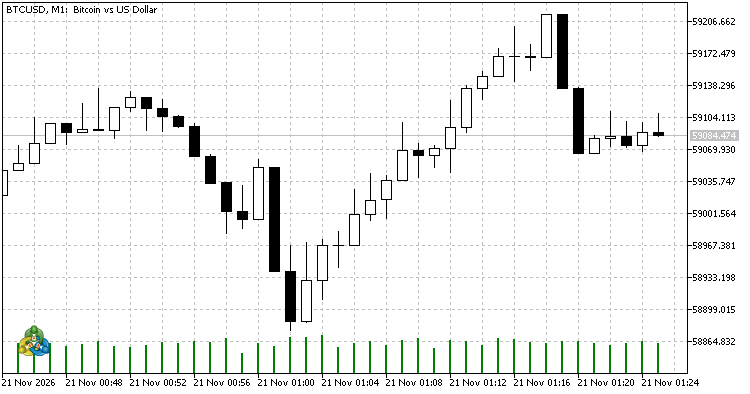
The tool is suitable for observing activity on different symbols and timeframes. The accompanying demonstration was performed using BTCUSD on the M1 timeframe.
Understanding the CSV Output
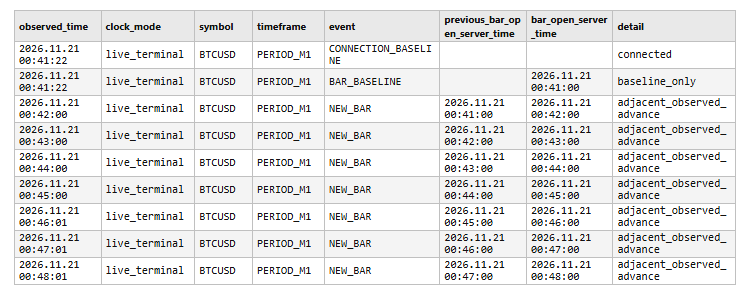
The generated CSV file provides a record of the events detected by the Expert Advisor.
New-bar records help identify when the logger observed the appearance of a new chart bar. Connection-related records provide information about the observed terminal connection state.
These records may be useful for:
-
Investigating missing or delayed signal events.
-
Comparing chart-bar activity with external automation logs.
-
Diagnosing interruptions in MT5-connected workflows.
-
Reviewing the behaviour of event-driven trading infrastructure.
-
Supporting development and testing of automated trading systems.
The CSV is a diagnostic record, not a transaction history or proof of successful order execution.
Testing and Validation
The utility was tested in a MetaTrader 5 demo environment.
During testing, the logger successfully recorded the initial connection and bar events, followed by seven consecutive BTCUSD M1 new-bar events without duplicate bar records in the observed sequence.
No trading orders were placed.
Connection-recovery handling was also tested through simulation. A forced live network-disconnection test was not performed.
These results describe the completed test scenarios and do not guarantee identical behaviour under every network or terminal condition.
Important Notes
-
The Expert Advisor is intended for diagnostic and educational use.
-
It does not generate trading recommendations or execute transactions.
-
Event detection depends on the terminal's operation and the data available to the program.
-
The generated CSV should be reviewed when investigating missing or unexpected activity.
-
This utility does not replace comprehensive monitoring, alerting or recovery infrastructure.
Developer
Savia Forex Software Solutions
This utility is provided as a free, standalone MQL5 CodeBase contribution for educational, diagnostic and development purposes.
 Gap and Weekend Map: Measuring Gap Fill Rate, Fill Time and Gap Size Relative to ATR
Marks every opening gap on the chart, measures its size in ATR units and follows it until price trades back to the fill level (previous close by default). A panel reports the fill rate, the median and 90th-percentile number of bars to fill, and the same figures for weekend gaps and for three gap-size buckets. Gaps that are still undecided are reported separately and never counted as filled.
 Session Time - session hours to broker server time with daylight saving
Converts session hours given in London, New York, Tokyo or Sydney time into broker server time, including US and EU daylight saving and the weeks when the two are out of step. Comes with a check script that verifies 15 hand-calculated cases.
Gold Level Map (XAUUSD): Round Numbers, Prior Day/Week Extremes and ADR
A clean on-chart map of psychological 00/50 figures, prior day and week extremes, and the average daily range, with honest bounce/break statistics. Display only — it does not trade.
XAUUSD Hourly Volatility Clock: typical range by hour vs today
A 24-hour clock of typical H1 ranges for XAUUSD (and any other symbol) versus the range of the current hour. The profile uses closed hours only. Display only — it does not trade.