 MetaTrader 5
 Experts
 Indicators
 Scripts
 Libraries
 Storage
Watch how to download trading robots for free
Find us on Facebook!
Join our fan page
Join our fan page
You liked the script? Try it in the MetaTrader 5 terminal

Tester vs Live Trade Matcher for MT5 - match a Strategy Tester report with your account history - indicator for MetaTrader 5

- Views:
- 23
- Published:
-
 You are missing trading opportunities:
- Free trading apps
- Over 8,000 signals for copying
- Economic news for exploring financial markets
Registration Log inYou agree to website policy and terms of use
If you do not have an account, please register -
 Need a robot or indicator based on this code? Order it on Freelance
Go to Freelance
A backtest looks great. Then the EA runs live and the numbers are different, and nobody can say why. Was it slippage, missed signals, a restart or a manual trade? Or was the backtest flattering?
Tester vs Live Trade Matcher answers that trade by trade, on MetaTrader 5. It never opens, modifies or closes orders.
What you get:
- Verdict: green (live matches
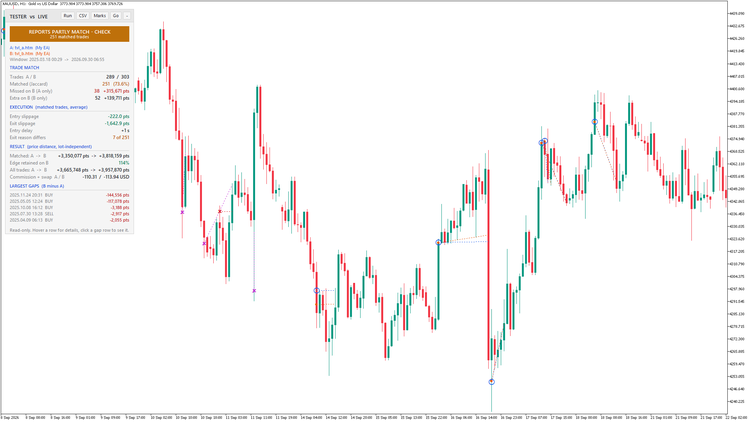 the backtest), amber (partly matches) or red (live differs).
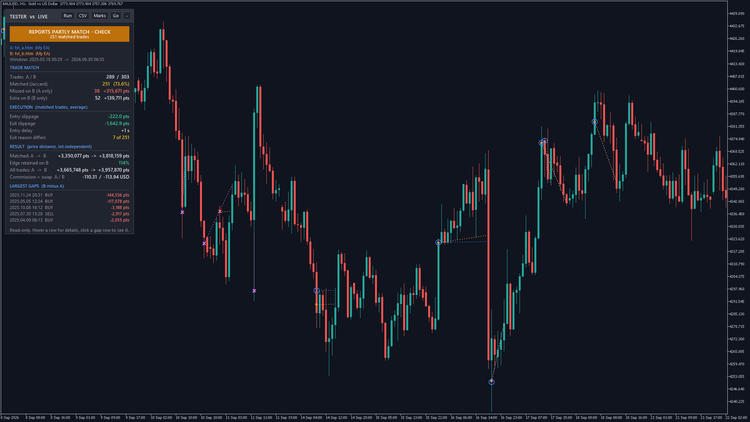
- Trade match: trades on each side and the match rate (Jaccard); trades the backtest took but live missed, and what they earned; extra live trades the backtest never took.
- Execution: average entry slippage, exit slippage and entry delay, plus trades where one side hit SL/TP and the other did not.
- Result: price distance captured on matched trades, backtest vs live (independent of lot size); the % of the backtest edge retained live; real commission and swap on both sides.
- Largest gaps: the 5 matched trades where live did worst against the backtest. Click a row to jump to that trade.
- Chart marks: blue ring = backtest entry, orange dot = live entry, dotted lines from entry to exit; red x = missed by live, magenta x = extra on live. Every mark has a tooltip.
- CSV export of the full trade-by-trade table.
Two modes:
- Report vs account history: the main use. Works on hedging and netting accounts.
- Report vs a second report: compare two brokers, two data feeds, or two versions of an EA.
Quick start:
- Save the Strategy Tester report as HTML (MetaTrader 5 and MetaTrader 4 reports both work).
- Copy the .htm file to MQL5\Files (File > Open Data Folder > MQL5 > Files).
- Attach the tool to a chart of the traded symbol. Set the report file name and the EA's magic number.
- Read the panel. Run re-reads everything, CSV writes the table, Marks shows or hides the trades, Go scrolls to the last compared trade. Click the title to fold the panel.
Nothing found? The panel says why and what to do (file not in the Files folder, no closed trades for that symbol or magic number, report and account do not overlap in time).
How matching works:
- Only closed trades are used, within the window where both sides overlap.
- Backtest trades are processed in time order. Each takes the nearest unused live trade in the same direction within the tolerance (default 180 s).
- Match rate = matched / (backtest + live - matched). Slippage is signed: positive means live got a worse price.
- Partly closed positions use the volume-weighted exit price.
Tested: on 11 pairs of real MetaTrader 5 and MetaTrader 4 reports the panel gives exactly the same numbers as an independent reference script, and an end-to-end test with 184 trades (hedging, partial closes, stop loss, take profit and manual exits) matched 184 of 184.
The verdict thresholds are practical rules of thumb, not statistics: green = match at least 90 % and edge retained at least 80 %; amber = at least 70 % and 50 %. For grid or basket EAs, lower the match tolerance.
Free to use, modify and share (MIT). No warranty, and nothing here is trading advice.
Range Filter Buy and Sell for MT5 - faithful port with signal statistics, alerts and session filter
A faithful MetaTrader 5 port of the TradingView "Range Filter Buy and Sell 5min" (DonovanWall / guikroth / tvenn): range filter line, target bands, Buy/Sell arrows and bar colors, no repainting, alerts (popup, sound, push, e-mail) and a signal statistics panel.
MTF Trend Dashboard — trend, position and volatility on six timeframes at a glance
One on-chart table for M15, H1, H4, D1, W1 and MN1: EMA slope, price vs EMA, Donchian position, ATR percentile and a combined UP / DOWN / RANGE regime. Completed bars only. Any symbol.
Adaptive SuperTrend K-Means for MT5 - port of AlgoAlpha Machine Learning Adaptive SuperTrend
A faithful MetaTrader 5 port of the open-source TradingView indicator "Machine Learning Adaptive SuperTrend" by AlgoAlpha: K-means clusters recent ATR into high, medium and low volatility, and the SuperTrend band uses the centroid of the current cluster. No repainting, alerts, gradient fill and statistics table.
MACD Signals
Indicator edition for new platform.