 MetaTrader 5
 Experts
 Indicators
 Scripts
 Libraries
 Storage
Watch how to download trading robots for free
Find us on Telegram!
Join our fan page
Join our fan page
You liked the script? Try it in the MetaTrader 5 terminal

MTF Trend Dashboard — trend, position and volatility on six timeframes at a glance - indicator for MetaTrader 5
Shipra Gupta

I’m Shipra Gupta, a trader and quantitative strategy developer with a strong background in mathematics, economics, and algorithmic trading systems. Over the years, I’ve worked extensively across forex, gold, indices, commodities, and crypto markets, focusing on building data-driven trading
- Views:
- 45
- Published:
-
 You are missing trading opportunities:
- Free trading apps
- Over 8,000 signals for copying
- Economic news for exploring financial markets
Registration Log inYou agree to website policy and terms of use
If you do not have an account, please register -
 Need a robot or indicator based on this code? Order it on Freelance
Go to Freelance
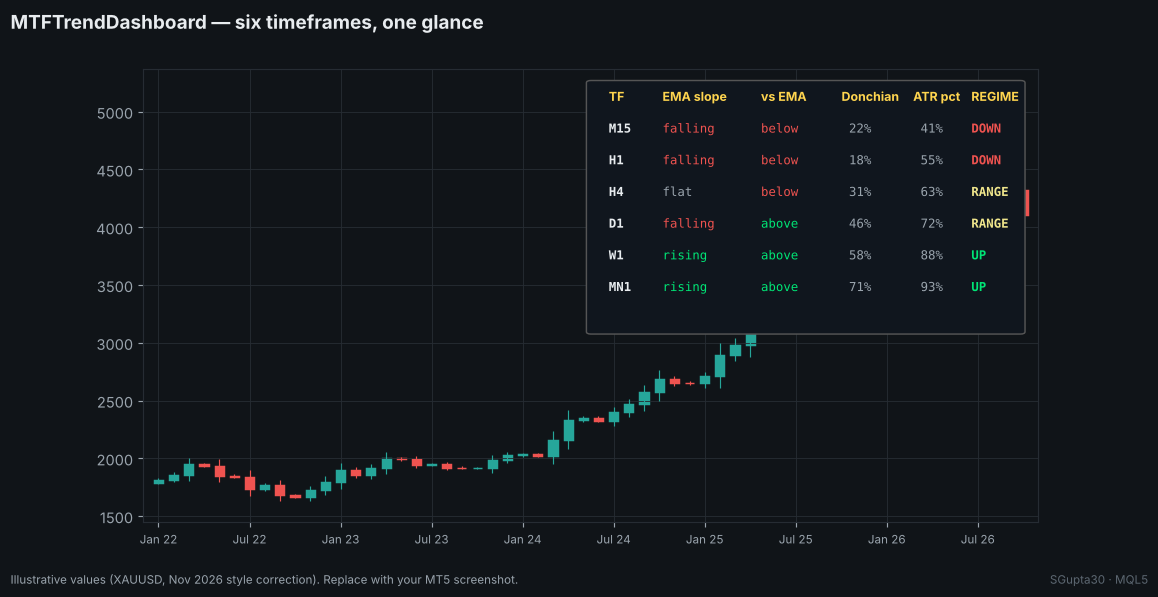
What you see
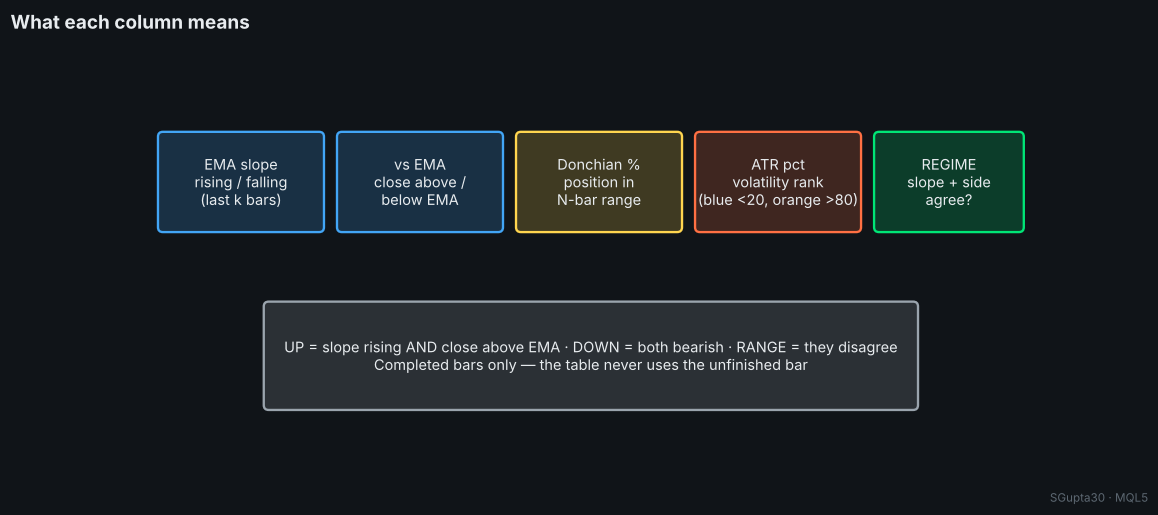
Each row is a timeframe and each column answers one question:
| Column | Question | Colours |
|---|---|---|
| EMA slope | Is the EMA rising or falling over the last k bars? | green / red |
| vs EMA | Is the last close above or below the EMA? | green / red |
| Donchian | Where is the close inside the last N-bar range (0–100%)? | green > 80%, red < 20% |
| ATR pct | How high is volatility versus the last 250 bars? | blue < 20% (quiet), orange > 80% (hot) |
| REGIME | Do slope and side agree? | UP / DOWN / RANGE |
When timeframes align
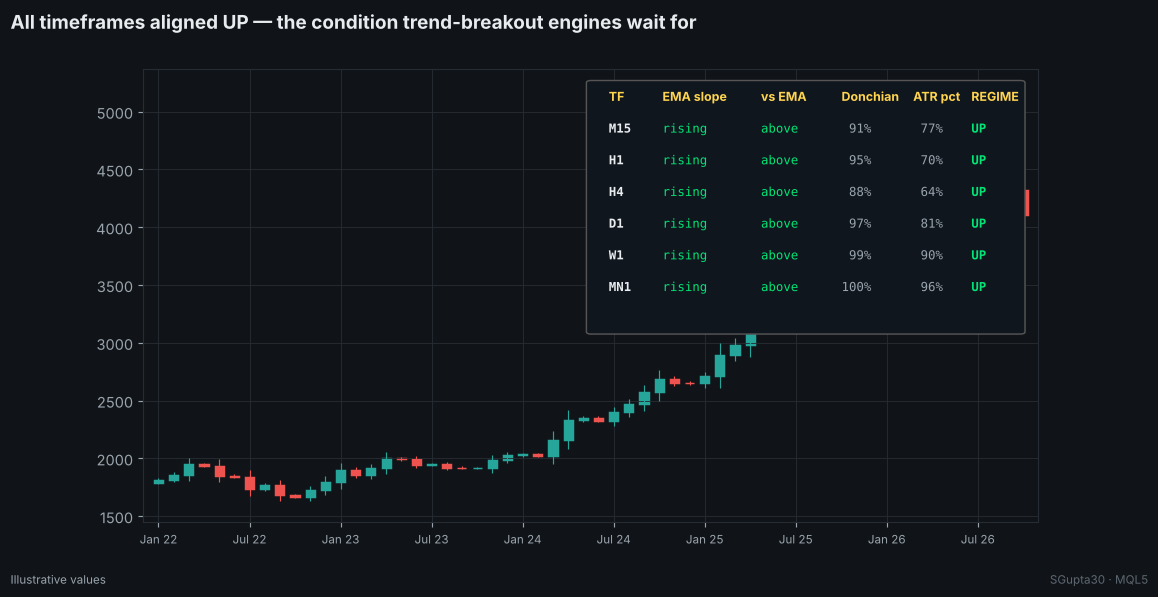
Trend-breakout systems earn most of their profit when the higher timeframes agree. A column of UP from H1 to MN1, with Donchian position near 100%, is the classic condition for long breakouts on gold. A mix of UP and DOWN tells you that the market is in a correction or a range, which is a reason to reduce risk or stand aside.
Inputs
| Input | Default | Description |
|---|---|---|
| Trend EMA period | 100 | EMA on every timeframe |
| EMA slope look-back | 3 | Completed bars for the slope |
| Donchian length | 50 | Range for the position % |
| ATR percentile look-back | 250 | Bars for the volatility rank |
| X / Y offset, corner | 12 / 24, right upper | Layout |
| Background | dark | Panel colour |
Implementation notes
- Uses one EMA and one ATR handle per timeframe and refreshes every 5 seconds.
- Reads completed bars only (shift 1), so the table never changes on the forming bar.
// regime rule used by the dashboard int regime = (slope>0 && close>ema) ? 1 : ((slope<0 && close<ema) ? -1 : 0); // UP / DOWN / RANGE
Author: Shipra Gupta (SGupta30) · the author's gold trend EAs use this kind of higher-timeframe regime filter.
 Breakeven and R-Trail Manager — break-even at +1R and R-multiple trailing for any trade
Utility EA that moves the stop to break-even plus a small lock once a trade reaches +X R, then trails it N R behind price. Manual trades or any EA by magic number. Never opens trades and never widens a stop.
ATR Trailing Stop Line (Chandelier Exit)
ATR Trailing Stop Line (Chandelier Exit): a volatility-based trailing stop that hangs below the highest high in an up-trend and rises above the lowest low in a down-trend, with trend-flip arrows, an on-chart status label and optional alerts.
Accelerator Oscillator (AC)
The Acceleration/Deceleration Indicator (AC) measures acceleration and deceleration of the current driving force.
MACD Signals
Indicator edition for new platform.