 MetaTrader 5
 Experts
 Indicators
 Scripts
 Libraries
 Storage
Watch how to download trading robots for free
Find us on Facebook!
Join our fan page
Join our fan page
You liked the script? Try it in the MetaTrader 5 terminal

Breakeven and R-Trail Manager — break-even at +1R and R-multiple trailing for any trade - expert for MetaTrader 5
Shipra Gupta

I’m Shipra Gupta, a trader and quantitative strategy developer with a strong background in mathematics, economics, and algorithmic trading systems. Over the years, I’ve worked extensively across forex, gold, indices, commodities, and crypto markets, focusing on building data-driven trading
- Views:
- 40
- Published:
-
 You are missing trading opportunities:
- Free trading apps
- Over 8,000 signals for copying
- Economic news for exploring financial markets
Registration Log inYou agree to website policy and terms of use
If you do not have an account, please register -
 Need a robot or indicator based on this code? Order it on Freelance
Go to Freelance
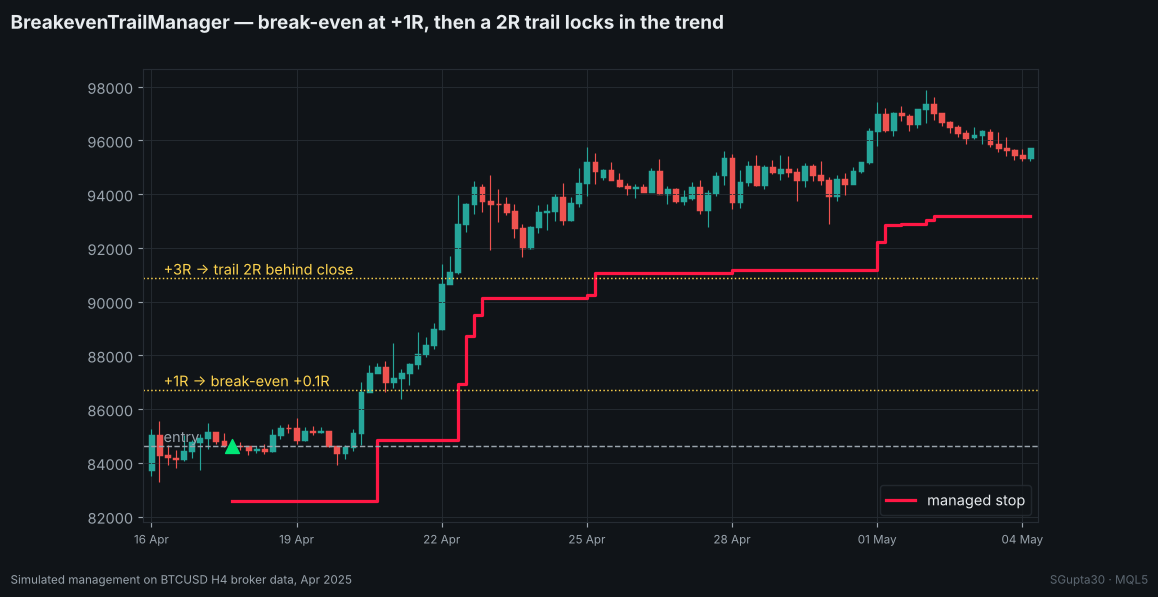
Why manage in R
R is the initial stop distance of a trade. Settings in R mean the same thing on gold at $1,800 and at $4,500, on Bitcoin and on EURUSD. You set the rule once and it scales with every trade.
Effect of break-even
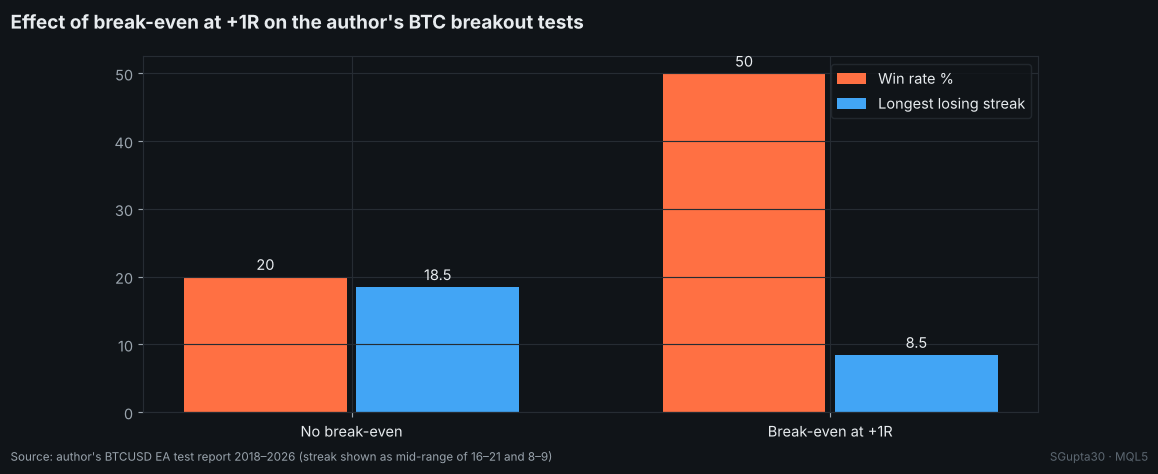
In the author's Bitcoin breakout tests, moving the stop to break-even at +1R was the most effective single change. The win rate rose from about 20% to about 50%, and the longest losing streak fell from 16–21 trades to 8–9. Many would-be losers became small scratch trades, and the big winners were not touched.
Logic
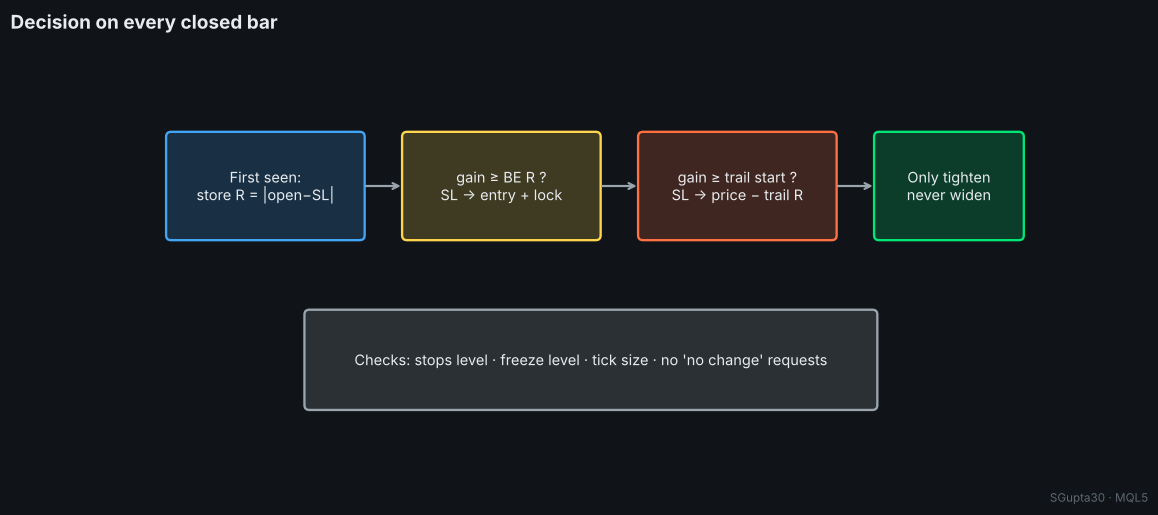
- When the manager first sees a position with a stop, it stores R = |open − SL| in a terminal global variable keyed by the ticket. The value survives terminal restarts and later stop changes.
- When the reference price reaches +BE R, the stop moves to entry ± Lock R.
- When it reaches +Trail start R, the stop trails Trail R behind the reference price.
- The stop only ever moves in the trade's favour.
The reference price is the close of the last completed bar of the chosen timeframe (default H1), which is how most backtests evaluate exits. It can also use the live bid/ask.
double gainR=(is_buy?px-open:open-px)/R; if(gainR>=InpBE_R) // break-even + lock new_sl=is_buy?MathMax(sl,open+InpLock_R*R):MathMin(sl,open-InpLock_R*R); if(InpTrailStartR>0 && gainR>=InpTrailStartR) // R trail new_sl=is_buy?MathMax(new_sl,px-InpTrail_R*R):MathMin(new_sl,px+InpTrail_R*R);
Inputs
| Input | Default | Description |
|---|---|---|
| Magic filter | −1 | −1 all trades, 0 manual only, or one magic number |
| Only chart symbol | true | Restrict to the chart symbol |
| Break-even trigger | 1.0 R | Distance that triggers break-even |
| Locked profit | 0.1 R | Profit locked at break-even |
| Trail start | 2.0 R | 0 = no trailing |
| Trail distance | 2.0 R | Distance behind price |
| Closed bars only | true | Evaluate once per bar |
| Bar timeframe | H1 | Timeframe for the closed-bar check |
Safety
- Positions without a stop are ignored, because R cannot be defined.
- Stops level and freeze level are checked before every change, prices are rounded to the tick size, and unchanged stops are never sent (no error 10025).
- Global variables of closed positions are cleaned every 30 seconds.
Author: Shipra Gupta (SGupta30) · the author's gold and Bitcoin EAs include break-even and R-based exits built in.
 ATR Trailing Stop Line (Chandelier Exit)
: a volatility-based trailing stop that hangs below the highest high in an up-trend and rises above the lowest low in a down-trend, with trend-flip arrows, an on-chart status label and optional alerts.
Kaufman Adaptive Moving Average (KAMA) Ribbon
A ribbon of Kaufman Adaptive Moving Averages with growing Efficiency Ratio periods, drawn in a monochrome gradient, with an on-chart label showing whether the ribbon is bullish, bearish or mixed.
MTF Trend Dashboard — trend, position and volatility on six timeframes at a glance
One on-chart table for M15, H1, H4, D1, W1 and MN1: EMA slope, price vs EMA, Donchian position, ATR percentile and a combined UP / DOWN / RANGE regime. Completed bars only. Any symbol.
MACD Signals
Indicator edition for new platform.