 MetaTrader 5
 Experts
 Indicators
 Scripts
 Libraries
 Storage
Watch how to download trading robots for free
Find us on Facebook!
Join our fan page
Join our fan page
You liked the script? Try it in the MetaTrader 5 terminal

Risk Lot Panel — drag the stop line, read the lot size for your risk percentage - indicator for MetaTrader 5
Shipra Gupta

I’m Shipra Gupta, a trader and quantitative strategy developer with a strong background in mathematics, economics, and algorithmic trading systems. Over the years, I’ve worked extensively across forex, gold, indices, commodities, and crypto markets, focusing on building data-driven trading
- Views:
- 23
- Published:
- Updated:
-
 You are missing trading opportunities:
- Free trading apps
- Over 8,000 signals for copying
- Economic news for exploring financial markets
Registration Log inYou agree to website policy and terms of use
If you do not have an account, please register -
 Need a robot or indicator based on this code? Order it on Freelance
Go to Freelance
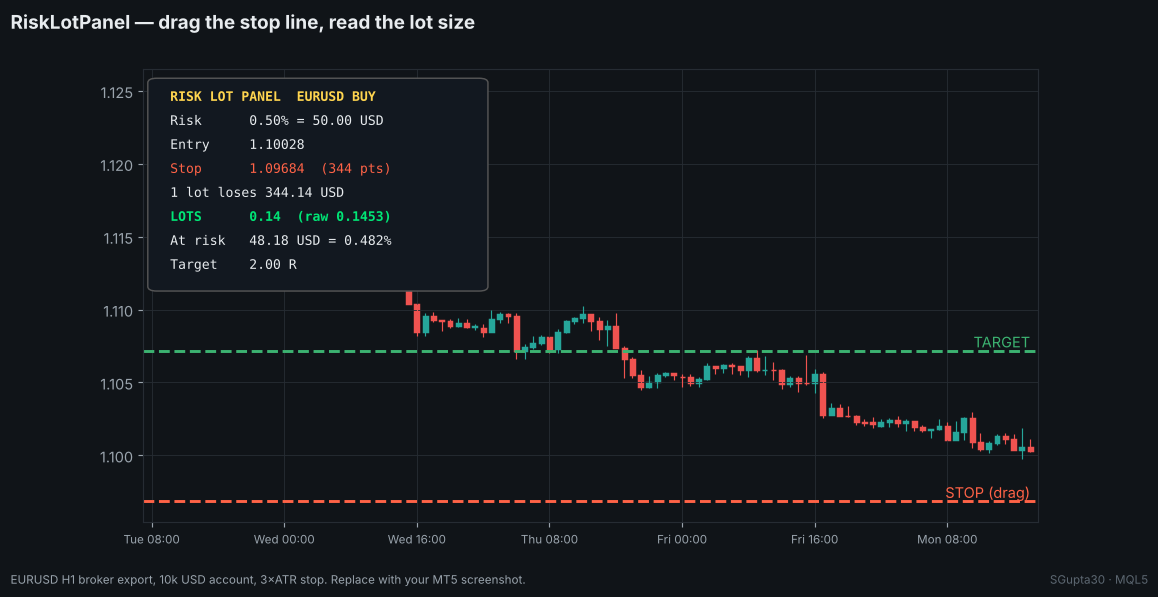
How to use
- Attach the indicator. A red STOP line appears 3 × ATR below the price and a green TARGET line at 2 R.
- Drag the STOP line to where your stop belongs. Put it above the price for a sell.
- Read LOTS in the panel and enter that size in your order.
The panel updates every second and immediately when a line is dragged.
| Panel row | Meaning |
|---|---|
| Risk | Risk % and the money it represents |
| Entry | Ask for a buy, bid for a sell |
| Stop | Stop price and distance in points |
| 1 lot loses | Money lost by 1.00 lot between entry and stop |
| LOTS | Size rounded down to the volume step (raw value in brackets) |
| At risk | Money actually at risk at that size |
| Target | Reward:risk of the target line |
Why it is correct on gold
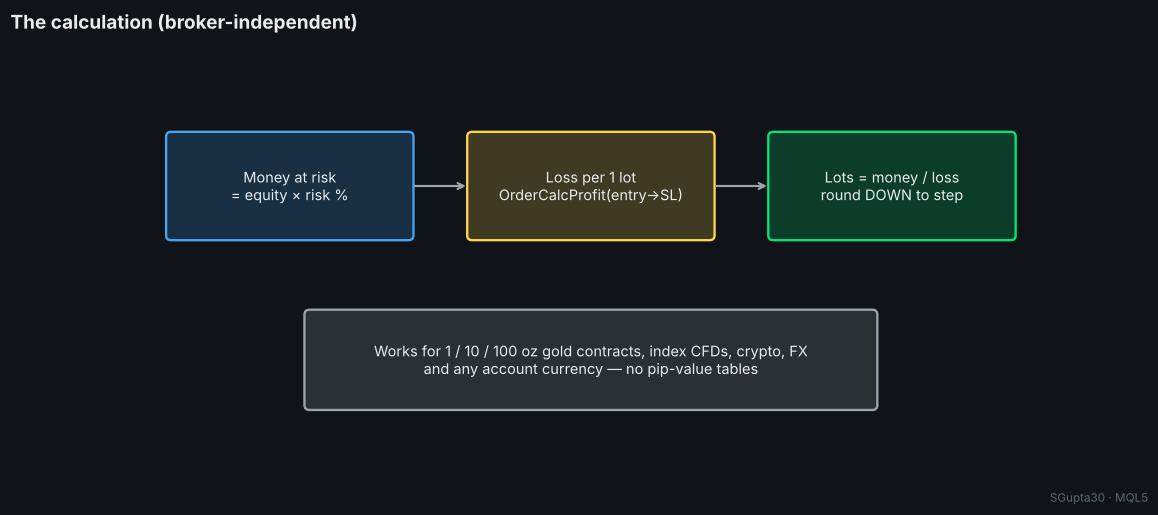
Pip-value formulas break on gold and CFDs: contract sizes differ between brokers (100 oz, 10 oz, 1 oz), profit currencies differ, and the account may be in EUR, GBP or INR. The panel asks the terminal with OrderCalcProfit() how much 1 lot loses between entry and stop, using the broker's own contract specification.
double LossPerLot(const ENUM_ORDER_TYPE t,const double entry,const double sl)
  {
   double p=0.0;
   if(!OrderCalcProfit(t,_Symbol,1.0,entry,sl,p)) return(0.0);
   return(MathAbs(p));
  }
// lots = equity * risk% / 100 / LossPerLot(...), rounded down to SYMBOL_VOLUME_STEP
Stop distance and size
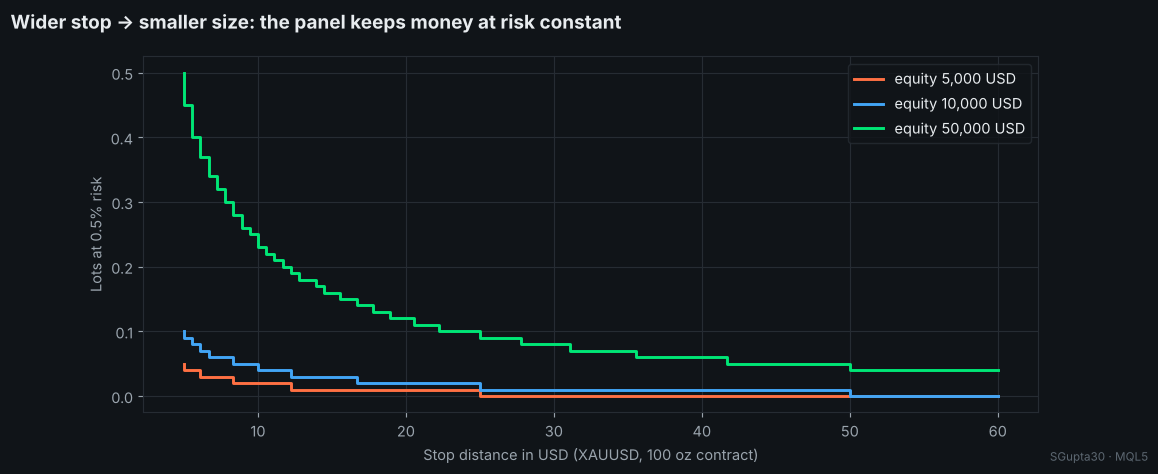
A wider stop gives a smaller size; the money at risk stays the same. If the minimum lot would already risk more than your budget, the panel shows 0.00 in red: the stop is too wide for that account size.
Inputs
| Input | Default | Description |
|---|---|---|
| Risk per trade, % | 0.50 | Risk per trade |
| Risk base | Equity | Equity or balance |
| Initial stop, ATR × | 3.0 | Where the stop line first appears |
| ATR timeframe | H1 | ATR timeframe |
| Show target line | true | Reward:risk line |
| Initial target, R | 2.0 | Where the target line first appears |
| Panel X / Y, colours | — | Layout |
Author: Shipra Gupta (SGupta30) · the author's Market EAs size every trade this way, with a hard stop on every position.
Volatility Squeeze Scanner — Bollinger inside Keltner, with momentum histogram
Shows when volatility is compressed (Bollinger Bands inside the Keltner Channel) and which way it releases. Red dots = squeeze on, green = released, four-colour momentum histogram. Wilder ATR, closed bars, no repaint.
Gold Donchian Breakout Channel (non-repainting, with HTF trend filter)
Donchian channel of the N bars before each bar, midline and confirmed breakout arrows that never repaint. Optional D1 EMA-slope filter shows only breakouts in the higher-timeframe trend. Alerts and push. Any symbol.
 Gold Trend Breakout Lite — educational XAUUSD trend-following EA
Open-source gold EA built on XAUUSD's multi-day trend persistence: H1 Donchian breakout in the direction of the D1 EMA slope, 3×ATR hard stop, break-even at +1R. Fixed lot, one position, no grid, no martingale.
MACD Signals
Indicator edition for new platform.