 MetaTrader 5
 Experts
 Indicators
 Scripts
 Libraries
 Storage
Watch how to download trading robots for free
Find us on Telegram!
Join our fan page
Join our fan page
You liked the script? Try it in the MetaTrader 5 terminal

Gold Donchian Breakout Channel (non-repainting, with HTF trend filter) - indicator for MetaTrader 5
Shipra Gupta

I’m Shipra Gupta, a trader and quantitative strategy developer with a strong background in mathematics, economics, and algorithmic trading systems. Over the years, I’ve worked extensively across forex, gold, indices, commodities, and crypto markets, focusing on building data-driven trading
- Views:
- 32
- Published:
- Updated:
-
 You are missing trading opportunities:
- Free trading apps
- Over 8,000 signals for copying
- Economic news for exploring financial markets
Registration Log inYou agree to website policy and terms of use
If you do not have an account, please register -
 Need a robot or indicator based on this code? Order it on Freelance
Go to Freelance
What it does
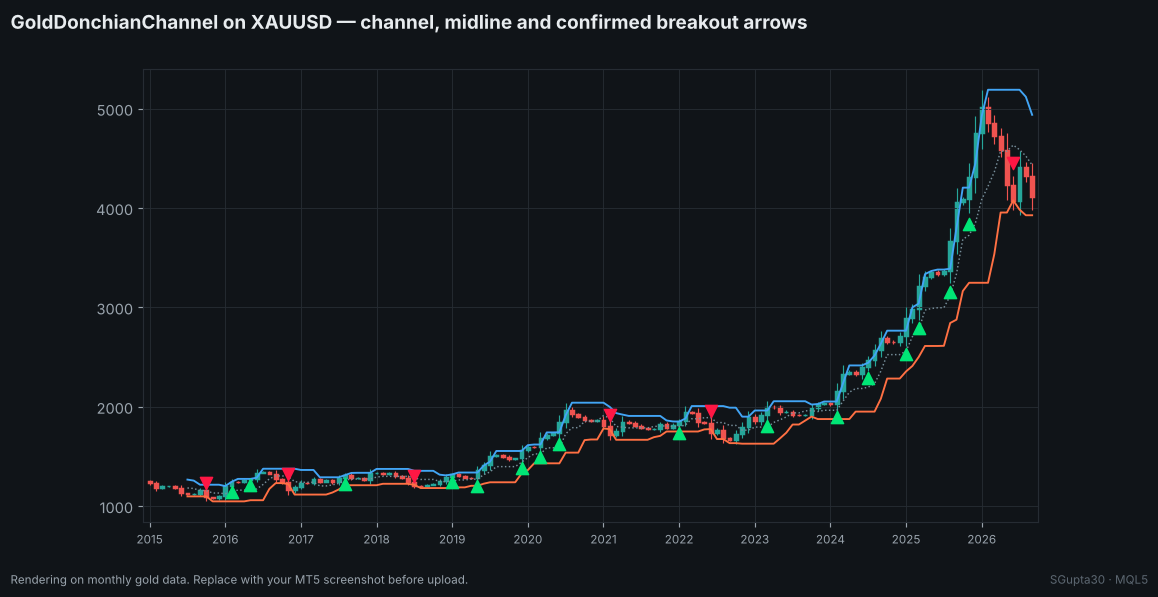
The indicator draws the highest high and lowest low of the N bars before each bar, plus the midline. When a bar closes beyond the channel for the first time, an arrow is placed on that bar.
- Blue line: upper channel. Orange line: lower channel. Dotted: midline.
- Green ▲: first close above the upper channel. Red ▼: first close below the lower channel.
With the trend filter on, an up-arrow is shown only while the D1 EMA is rising over the last k completed daily bars, and a down-arrow only while it is falling.
Why it never repaints
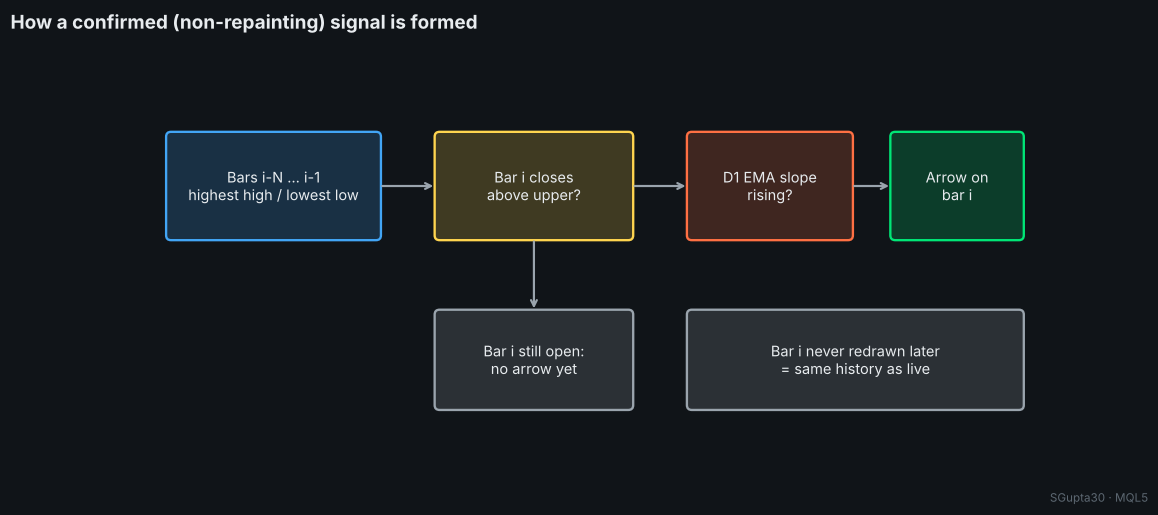
- The channel of bar i uses bars i−N … i−1 only, so the current bar can break it.
- Arrows are written only for closed bars — the forming bar never shows one.
- The higher-timeframe filter reads the last completed daily bar, so there is no look-ahead in the Strategy Tester either.
What you see in history is exactly what you would have seen live.
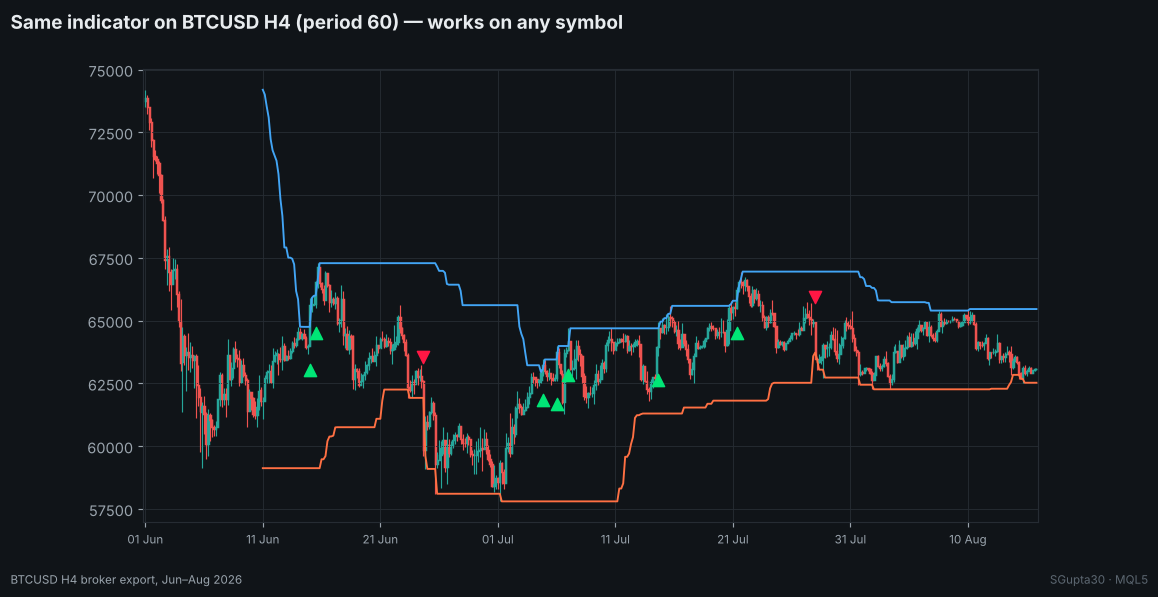
Works on any market
| Market | Timeframe | Period | Trend filter |
|---|---|---|---|
| XAUUSD swing | H1 | 120 (≈ one week) | D1 EMA 100 |
| XAUUSD position | H4 | 40–80 | D1 EMA 50 |
| BTCUSD | H1 / H4 | 60–160 | D1 EMA 50–100 |
| Indices | H1 | 80–120 | D1 EMA 100 |
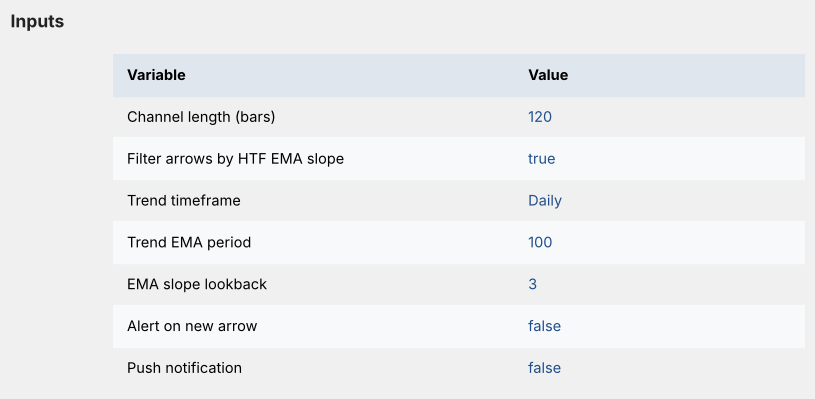
Inputs
| Input | Default | Description |
|---|---|---|
| Channel length | 120 | Bars in the channel |
| Filter by HTF EMA slope | true | Show only trend-direction breakouts |
| Trend timeframe | D1 | Timeframe of the filter |
| Trend EMA period | 100 | EMA length |
| EMA slope look-back | 3 | Completed HTF bars for the slope |
| Alert / Push | false | Notify on a new confirmed arrow |
Using it from an EA
| Buffer | Content |
|---|---|
| 0 / 1 / 2 | Upper / lower / mid channel |
| 3 | Breakout up (price or EMPTY_VALUE) |
| 4 | Breakout down (price or EMPTY_VALUE) |
int h=iCustom(_Symbol,PERIOD_H1,"GoldDonchianChannel",120,true,PERIOD_D1,100,3,false,false);
double up[];
if(CopyBuffer(h,3,1,1,up)==1 && up[0]!=EMPTY_VALUE)
   Print("confirmed breakout on the last closed bar");
Background
The author's research on XAUUSD M1 data from 2010 to 2026 found that H1/H4 Donchian breakouts in the direction of the D1 EMA trend, with wide ATR stops, were profitable across a broad parameter grid in- and out-of-sample. This indicator shows that signal on your chart; the full trading logic is explained in the author's MQL5 article on building a gold trend-breakout EA.
Author: Shipra Gupta (SGupta30) · complete gold and Bitcoin breakout EAs are in the author's Market profile.
 Broker Tick and Rollover Spread Forensic Auditor
Read-only forensic script that audits historical broker Bid/Ask ticks in 15-day RAM-safe chunks: computes session spread percentiles (P50/P95), 23:00-00:15 rollover widening ratios, weekday feed blackout gaps, and exports clean millisecond CSV files.
Relative Volume (RVOL) Indicator in a Subwindow
Relative Volume (RVOL) in a subwindow: the volume of every bar divided by its normal volume, drawn as a color-coded histogram with reference levels and a live text label.
Volatility Squeeze Scanner — Bollinger inside Keltner, with momentum histogram
Shows when volatility is compressed (Bollinger Bands inside the Keltner Channel) and which way it releases. Red dots = squeeze on, green = released, four-colour momentum histogram. Wilder ATR, closed bars, no repaint.
Risk Lot Panel — drag the stop line, read the lot size for your risk percentage
On-chart position-size calculator. Drag the stop line (and optional target line) and the panel shows lots for your risk %, money at risk and reward:risk. Uses OrderCalcProfit, so it is correct for gold, indices, crypto, FX and any account currency.