 MetaTrader 5
 Experts
 Indicators
 Scripts
 Libraries
 Storage
Watch how to download trading robots for free
Find us on Telegram!
Join our fan page
Join our fan page
You liked the script? Try it in the MetaTrader 5 terminal

ATR Dynamic Support and Resistance Bands - indicator for MetaTrader 5

- Views:
- 20
- Published:
-
 You are missing trading opportunities:
- Free trading apps
- Over 8,000 signals for copying
- Economic news for exploring financial markets
Registration Log inYou agree to website policy and terms of use
If you do not have an account, please register -
 Need a robot or indicator based on this code? Order it on Freelance
Go to Freelance

ATR Dynamic Support and Resistance Bands
The idea behind it
Fixed price levels do not adapt to the market: a 50-pip move means a lot on a quiet day and very little on a volatile one. This indicator solves that by measuring the distance from a central moving average in units of ATR, the average true range of recent bars.
The upper band is basis + multiplier x ATR and the lower band is basis - multiplier x ATR. Price tends to react near these bands, so they work as dynamic resistance and support that automatically adjust to current volatility.
The ATR is calculated inside the indicator with Wilder smoothing, so no indicator handles are needed. On each new tick only the last bar is recalculated, and the full history is processed only once at start.
How to interpret it
- Upper band (dashed line) - dynamic resistance. Price reaching it in a range can signal an overextended move; a close beyond it with expanding bands can signal a breakout.
- Lower band (dashed line) - dynamic support, interpreted in the same way for downward moves.
- Basis line (dotted line) - the moving average (SMA or EMA) that the bands are built around. It acts as the "mean" price and as dynamic support or resistance inside a trend.
- Distance between the bands - a direct view of volatility. Narrowing bands show a quiet market and often precede a volatility expansion; widening bands show increasing volatility.
- Info label (top-left corner) - the ATR settings and the current ATR value in price units, useful for sizing stop-losses and targets.
Bands are context, not signals on their own. In a strong trend price can walk along a band for a long time, so confirm with price action or other tools.
External variables (inputs)
| Input | Default | Purpose |
|---|---|---|
| Basis line | ||
| InpBasisPeriod | 20 | Period of the basis moving average (2 and above) |
| InpBasisMethod | BASIS_SMA | Basis moving average method: BASIS_SMA (simple) or BASIS_EMA (exponential) |
| ATR bands | ||
| InpAtrPeriod | 14 | ATR period (1 and above) |
| InpMultiplier | 2.0 | ATR multiplier; the distance of each band from the basis (must be greater than zero) |
| Appearance | ||
| InpUpperColor | clrWhite | Color of the upper band |
| InpLowerColor | clrSilver | Color of the lower band |
| InpBasisColor | clrGray | Color of the basis line |
| InpBandStyle | STYLE_DASH | Line style of the upper and lower bands |
| InpBasisStyle | STYLE_DOT | Line style of the basis line |
| InpLineWidth | 1 | Line width of all lines (1 to 5) |
| InpShowBasis | true | Show or hide the basis line |
| Info label | ||
| InpShowInfo | true | Show the info label with the ATR value in the chart corner |
| InpInfoColor | clrWhite | Color of the info label |
Recommended use
- Works on any symbol and timeframe. Start with the defaults (SMA 20, ATR 14, multiplier 2.0) on M15 to H4 charts.
- A smaller multiplier (1.0-1.5) gives tighter bands for scalping and short-term targets; a larger one (2.5-3.0) highlights only extreme moves.
- The EMA basis reacts faster to price changes, the SMA is smoother. Choose according to your style.
- The values of closed bars do not change (no repainting). The last bar is recalculated while it is forming, as with any moving average or ATR.
- The ATR is a lagging measure, so after a sudden news spike the bands adapt only over the next bars.
- The indicator needs at least a few more bars than the larger of the two periods to start drawing.
- It is a chart indicator only and does not trade, so it works the same on netting and hedging accounts.
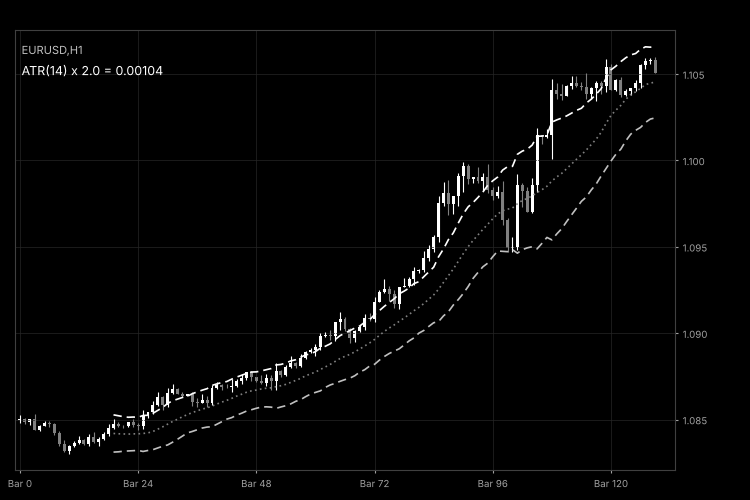 Fig. 1. AtrBands on an H1 chart with default settings (black and white image per Code Base guidelines).
 Supertrend EA Gold Breakeven
Supertrend expert advisor for MT5 on Gold (XAUUSD), forex and indices: entry on the closed candle of the flip, stop at the Supertrend line, target by stop multiple, breakeven and lot by risk percent. Open source code.
Daily Pivot Points – Classic, Fibonacci and Camarilla
Daily pivot point with three resistance levels and three support levels, using Classic, Fibonacci or Camarilla formulas.
Candle Countdown Timer and Spread Display on Chart
Shows the time left until the current candle closes and the current spread in a corner of the chart. The countdown updates every second, even when no new ticks arrive.
MACD Signals
Indicator edition for new platform.