 MetaTrader 5
 Experts
 Indicators
 Scripts
 Libraries
 Storage
Watch how to download trading robots for free
Find us on Facebook!
Join our fan page
Join our fan page
You liked the script? Try it in the MetaTrader 5 terminal

Daily Pivot Points – Classic, Fibonacci and Camarilla - indicator for MetaTrader 5

- Views:
- 8
- Published:
-
 You are missing trading opportunities:
- Free trading apps
- Over 8,000 signals for copying
- Economic news for exploring financial markets
Registration Log inYou agree to website policy and terms of use
If you do not have an account, please register -
 Need a robot or indicator based on this code? Order it on Freelance
Go to Freelance

PivotPoints plots the daily pivot point and three levels of resistance and support, calculated from the previous day’s high, low and close. Pivot levels are a classic reference point for intraday traders because many market participants monitor the same price levels.
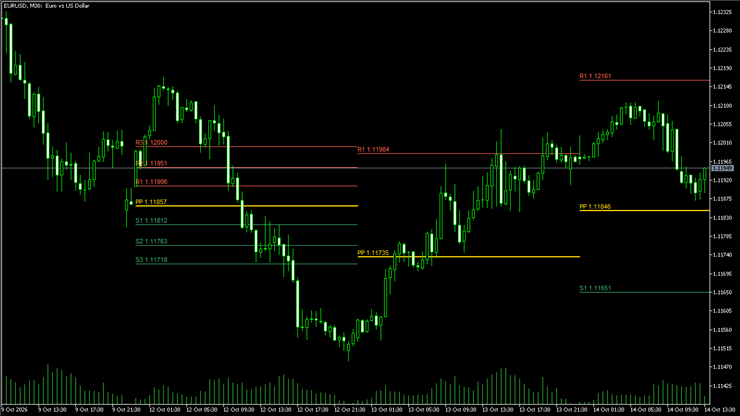
What it displays:
- PP: the pivot point (gold)
- R1, R2, R3: resistance levels (red)
- S1, S2, S3: support levels (green)
- The levels for the last few days, each valid for its own day
Available formulas:
- Classic: PP = (High + Low + Close) / 3, R1 = 2 × PP – Low, S1 = 2 × PP – High, R2/S2 = PP ± range, R3/S3 extended
- Fibonacci: PP plus and minus 0.382, 0.618 and 1.000 of the previous day’s range
- Camarilla: close plus and minus 1.1 × range / 12, / 6 and / 4
Inputs:
- Formula, number of days to plot
- Text labels on/off, colour of pivot, resistance and support levels
Notes:
- Works on any symbol and any timeframe; the levels are derived from the daily candles
- The day’s levels are fixed at the day’s open and do not repaint
- It is an information tool, not a trading system: it does not guarantee any profit
How to use:
1. Copy PivotPoints.mq5 into the MQL5\Indicators folder of your trading platform (File – Open Data Folder) and compile it in MetaEditor.
2. Drag PivotPoints from the Navigator window onto a chart.
3. Select your preferred formula in the ‘Inputs’ tab.
Tips:
- Observe how the price reacts when it reaches PP, R1 or S1 before looking at the outer levels.
- Combine the pivot points with the previous day’s high and low to identify areas where several levels converge.
Translated from Italian by MetaQuotes Ltd.
Original code: https://www.mql5.com/it/code/78385
 CreyesHistoryCSV - Closed trades to CSV with summary
Script that exports the closed trades of your account to a CSV file and prints a short summary: trades, win rate, net result and profit factor.
 Daily Drawdown Guard
An account-wide MetaTrader 5 utility that tracks daily loss from the chosen start-of-day equity and intraday equity peak. Shows warning and critical levels with optional money and percent limits plus terminal, sound or push alerts. It never places, modifies or closes trades.
Accelerator Oscillator (AC)
The Acceleration/Deceleration Indicator (AC) measures acceleration and deceleration of the current driving force.
MACD Signals
Indicator edition for new platform.