 MetaTrader 5
 Experts
 Indicators
 Scripts
 Libraries
 Storage
Watch how to download trading robots for free
Find us on Twitter!
Join our fan page
Join our fan page
You liked the script? Try it in the MetaTrader 5 terminal

CreyesHistoryCSV - Closed trades to CSV with summary - script for MetaTrader 5
Cesar De Los Reyes Sanchez

I design and develop expert advisors (EAs), indicators and trading utilities for MetaTrader 5. My focus is rule-based systems with clear logic and built-in risk management: fixed stop loss, risk per trade as a percentage of the account, daily loss limits and account protections. No martingale, no
- Views:
- 39
- Published:
-
 You are missing trading opportunities:
- Free trading apps
- Over 8,000 signals for copying
- Economic news for exploring financial markets
Registration Log inYou agree to website policy and terms of use
If you do not have an account, please register -
 Need a robot or indicator based on this code? Order it on Freelance
Go to Freelance

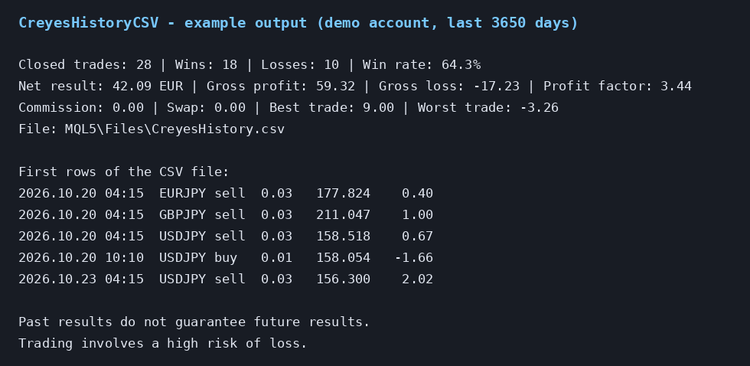
CreyesHistoryCSV reads the closed trades of the trading account and saves them in a CSV file that can be opened in Excel, LibreOffice or any other spreadsheet. It also prints a short summary in the Experts tab. The script is read-only: it never opens, modifies or closes trades.
How to use it
1. Copy CreyesHistoryCSV.mq5 to the MQL5\Scripts folder of your terminal (or compile it from MetaEditor).
2. Drag the script from the Navigator to any chart.
3. Set the inputs and press OK.
4. Open the file in the MQL5\Files folder (File - Open Data Folder).
Inputs
- InpDays: number of days of history to export, from 1 to 3650.
- InpSymbol: symbol filter. Empty means all symbols.
- InpMagic: magic number filter. -1 means all magic numbers.
- InpFileName: name of the CSV file, saved in MQL5\Files.
- InpSeparator: column separator (comma by default; use a semicolon if your spreadsheet expects it).
CSV columns
Time, Deal, Position, Symbol, Type (direction of the position), Volume, Price, Profit, Commission, Swap, Net, Magic, Comment.
Summary
The summary shows the number of closed trades, wins and losses, win rate, net result, gross profit, gross loss, profit factor, commission, swap, best trade and worst trade, in the currency of the account.
Notes
- Only deals that close a position are exported. Deposits and withdrawals are ignored.
- The terminal must have the account history loaded. If it is incomplete, open the History tab, right-click and select All History.
- The example image shows the output on a demo account. Past results do not guarantee future results. Trading involves a high risk of loss.
 Daily Drawdown Guard
An account-wide MetaTrader 5 utility that tracks daily loss from the chosen start-of-day equity and intraday equity peak. Shows warning and critical levels with optional money and percent limits plus terminal, sound or push alerts. It never places, modifies or closes trades.
 Session Range Box
Draw Asian, London and New York session ranges as chart boxes with high/low lines, labels and an optional London–New York overlap. Configure GMT or broker-server hours and review the latest session statistics in a panel.
Daily Pivot Points – Classic, Fibonacci and Camarilla
Daily pivot point with three resistance levels and three support levels, using Classic, Fibonacci or Camarilla formulas.
MACD Signals
Indicator edition for new platform.