 MetaTrader 5
 Experts
 Indicators
 Scripts
 Libraries
 Storage
Watch how to download trading robots for free
Find us on Telegram!
Join our fan page
Join our fan page
You liked the script? Try it in the MetaTrader 5 terminal

History Export from the Strategy Tester (Bars and Ticks) - expert for MetaTrader 5

- Views:
- 48
- Rating:
- Published:
-
 You are missing trading opportunities:
- Free trading apps
- Over 8,000 signals for copying
- Economic news for exploring financial markets
Registration Log inYou agree to website policy and terms of use
If you do not have an account, please register -
 Need a robot or indicator based on this code? Order it on Freelance
Go to Freelance

Exports price history from the Strategy Tester to CSV files: closed bars of any timeframe and, optionally, every tick.
Why from the tester? On a chart, history is limited by the "Max bars in chart" setting (100,000 bars by default, about three months of M1 data). The tester has no such limit, so years of M1 bars, or the real ticks of a period, come out in one run.
How to use
- In the Strategy Tester, select HistoryExportTester, the symbol and the date range. The test timeframe does not matter: the exported timeframe is set by an input.
- For bars only, any model works, and "1 minute OHLC" is the fastest. For ticks, use "Every tick based on real ticks"; other models export the tester's generated ticks.
- Run the test. The files are written to Terminal\Common\Files (or to the tester agent's MQL5\Files folder when "Write to the common folder" is off).
Files
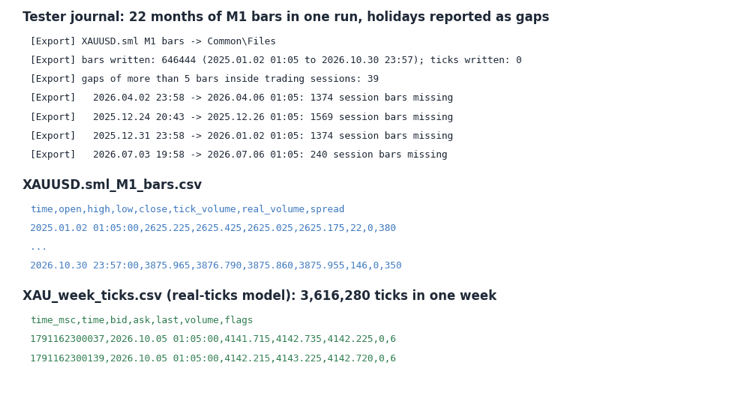
- <symbol>_<timeframe>_bars.csv: time, open, high, low, close, tick_volume, real_volume, spread. Only closed bars are written; the bar still forming when the test ends is skipped.
- <symbol>_ticks.csv: time_msc, time, bid, ask, last, volume, flags.
Gap report. At the end, the journal shows how many gaps longer than N bars fall inside the symbol's trading sessions, and lists the ten largest. Weekends and daily breaks are not gaps. Market holidays are reported, because the session schedule still lists them as trading time.
Example (XAUUSD on a demo account): 646,444 M1 bars from January 2025 to October 2026 in one run, with 39 gaps, all of them holidays (Good Friday, Christmas, New Year, early closes on US holidays). One week of real ticks was 3.6 million ticks, about 240 MB of CSV, so export ticks in short date ranges.
Inputs
- Bars to export: the timeframe (default M1).
- Also export every tick: default false.
- File name prefix: default is the symbol name.
- Write to the common folder: default true.
- Report gaps longer than this many bars: default 5.
The Expert Advisor only reads data and never places, modifies or closes an order.
 MTF Order Block Zones Indicator
MTF order blocks from the chart timeframe or a higher one, shaded on the chart and followed bar by bar: fresh until price comes back, tested after that with every return counted, broken once a close goes through. Sizes are measured in average ranges, so the defaults fit any symbol, and a new zone absorbs the ones it overlaps, so zones never stack.
Info Panel – candle countdown, spread, ATR and daily range
Panel showing a candle countdown, spread, daily ATR and the proportion of the daily range already used.
NY Open Candle: The Basics
A basic expert advisor that trades in the direction of the 9.30 am New York 5-minute candle on index CFDs (US100 / NAS100). One trade per day, fixed stop-loss and take-profit levels, forced closure; no martingale or grid strategy.
Round Numbers – automatic psychological thresholds
Horizontal lines at round figures around the displayed price, with a spacing that adjusts according to the zoom level.