 MetaTrader 5
 Experts
 Indicators
 Scripts
 Libraries
 Storage
Watch how to download trading robots for free
Find us on Twitter!
Join our fan page
Join our fan page
You liked the script? Try it in the MetaTrader 5 terminal

Round Numbers – automatic psychological thresholds - indicator for MetaTrader 5

- Views:
- 17
- Published:
-
 You are missing trading opportunities:
- Free trading apps
- Over 8,000 signals for copying
- Economic news for exploring financial markets
Registration Log inYou agree to website policy and terms of use
If you do not have an account, please register -
 Need a robot or indicator based on this code? Order it on Freelance
Go to Freelance

RoundNumbers draws horizontal lines at the round numbers surrounding the price displayed on the screen, for example 1.1000 and 1.1050 on EUR/USD, 2650.00 on gold or 30500 on a stock index. Round numbers are psychological levels where many orders are placed, so the price often reacts around them.
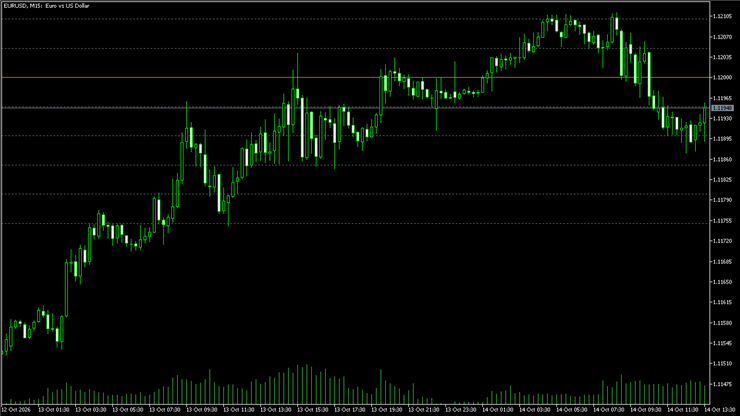
What it draws:
- A thin dotted line at every step of the grid
- A thicker solid line at every tenth step (the major figures)
- The step size is determined automatically based on the chart’s zoom level, ensuring the screen always displays a manageable number of lines
- The lines follow the chart when you scroll or change the scale
Inputs:
- Fixed step in price units (0 = automatic)
- Maximum number of lines on the screen for the automatic step
- Colours of minor and major levels and the style of minor lines
Notes:
- Works on any instrument (forex, metals, indices, cryptocurrencies) and any timeframe
- Only the visible area is plotted, so it is light on system resources
- It is an information tool, not a trading system: it does not guarantee any profit
How to use:
1. Copy RoundNumbers.mq5 into the MQL5\Indicators folder of your terminal (File – Open Data Folder) and compile it in MetaEditor.
2. Drag RoundNumbers from the Navigator window onto a chart.
3. Leave the step set to 0 for the automatic grid, or enter your own step (0.0050 for a 50-pip grid on EURUSD).
Tips:
- Check how the price behaves as it approaches a major (solid) level, using the previous day’s high and low as a secondary reference.
- Round numbers are good places to look for stop and target areas, not exact entry points.
Translated from Italian by MetaQuotes Ltd.
Original code: https://www.mql5.com/it/code/78386
 NY Open Candle: The Basics
A basic expert advisor that trades in the direction of the 9.30 am New York 5-minute candle on index CFDs (US100 / NAS100). One trade per day, fixed stop-loss and take-profit levels, forced closure; no martingale or grid strategy.
History Export from the Strategy Tester (Bars and Ticks)
Exports bars of any timeframe and, optionally, every tick from the Strategy Tester to CSV, without the chart's 100,000-bar limit. Reports gaps inside trading sessions. Places no orders.
Accelerator Oscillator (AC)
The Acceleration/Deceleration Indicator (AC) measures acceleration and deceleration of the current driving force.
MACD Signals
Indicator edition for new platform.