 MetaTrader 5
 Experts
 Indicators
 Scripts
 Libraries
 Storage
Watch how to download trading robots for free
Find us on Facebook!
Join our fan page
Join our fan page
You liked the script? Try it in the MetaTrader 5 terminal

Info Panel – candle countdown, spread, ATR and daily range - indicator for MetaTrader 5

- Views:
- 41
- Published:
-
 You are missing trading opportunities:
- Free trading apps
- Over 8,000 signals for copying
- Economic news for exploring financial markets
Registration Log inYou agree to website policy and terms of use
If you do not have an account, please register -
 Need a robot or indicator based on this code? Order it on Freelance
Go to Freelance

InfoPanel is a compact panel displayed on the chart that shows the information you check regularly: the time remaining until the current candle closes, the current spread, the daily ATR and what proportion of the average daily range has already been used today.
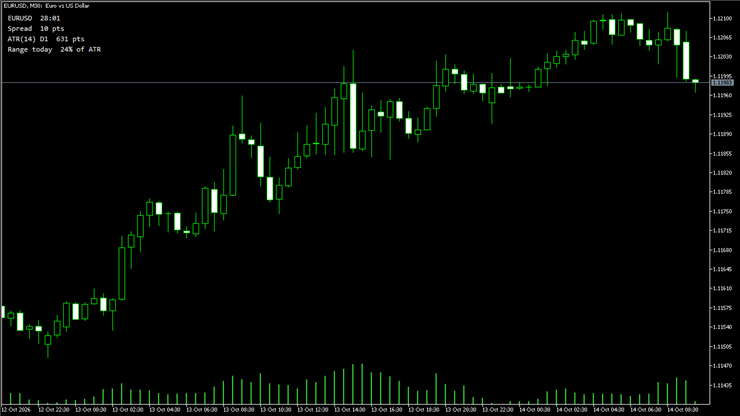
What it shows:
- Symbol and countdown to the close of the current candle
- Spread in points (turns red when it is wide)
- ATR for the daily timeframe, in points
- Today’s range as a percentage of the daily ATR (turns gold above 100 per cent)
Inputs:
- ATR period
- Corner of the chart, X and Y offsets, font size and text colour
Notes:
- Works on any symbol and any timeframe
- Light on resources: one timer per second and four text labels
- No signals: purely for information purposes
How to use:
1. Copy InfoPanel.mq5 into the MQL5\Indicators folder of your terminal (File – Open Data Folder) and compile it in MetaEditor.
2. Drag InfoPanel from the Navigator window onto any chart.
3. Adjust the corner, offsets and colour in the ‘Inputs’ tab if you wish to reposition the panel.
Tips:
- When the range used is already above 100 per cent, the day’s price movement has been greater than usual: exercise caution with new entries.
- A wide spread (red) is a good time to avoid market orders.
Translated from Italian by MetaQuotes Ltd.
Original code: https://www.mql5.com/it/code/78379
Session Clock
An animated 24-hour dial of the Sydney, Tokyo, London and New York sessions with automatic daylight saving time, a countdown to the close of the current candle, and live spread and day range. The panel collapses into a bar and can be dragged on the chart.
 Trade Pad
An animated one-click trading panel for the chart symbol: buy and sell with live prices, lot stepper, close all, close profit, close loss and breakeven, with confirmations, a practice mode and a collapsible, draggable panel.
MTF Order Block Zones Indicator
MTF order blocks from the chart timeframe or a higher one, shaded on the chart and followed bar by bar: fresh until price comes back, tested after that with every return counted, broken once a close goes through. Sizes are measured in average ranges, so the defaults fit any symbol, and a new zone absorbs the ones it overlaps, so zones never stack.
History Export from the Strategy Tester (Bars and Ticks)
Exports bars of any timeframe and, optionally, every tick from the Strategy Tester to CSV, without the chart's 100,000-bar limit. Reports gaps inside trading sessions. Places no orders.