 MetaTrader 5
 Experts
 Indicators
 Scripts
 Libraries
 Storage
Join our fan page

Exponential Trend Channel Indicator - indicator for MetaTrader 5

-
🤖 EXPERT ADVISORS
► Awesome Oscillator Pullback EA for EURUSD:
https://www.mql5.com/en/code/78891
► Stochastic Daily Breakout for Gold:
- Views:
- 50
- Rating:
- Published:
-
 You are missing trading opportunities:
- Free trading apps
- Over 8,000 signals for copying
- Economic news for exploring financial markets
Registration Log inYou agree to website policy and terms of use
If you do not have an account, please register -
 Need a robot or indicator based on this code? Order it on Freelance
Go to Freelance
The price scale in MetaTrader 5 is linear, and on a linear scale a trend that grows by a steady percentage is not a straight line. It bends: upward when it rises, flattening out when it falls. A straight channel laid over that trend sits too high in the middle and too low at both ends. This indicator fits the trend on the logarithm of price, where steady growth really is straight, and paints it back on your chart as the curve it actually is, bar by bar, with zones, a projection and a card that tells you how clean the trend is and how fast it is moving.
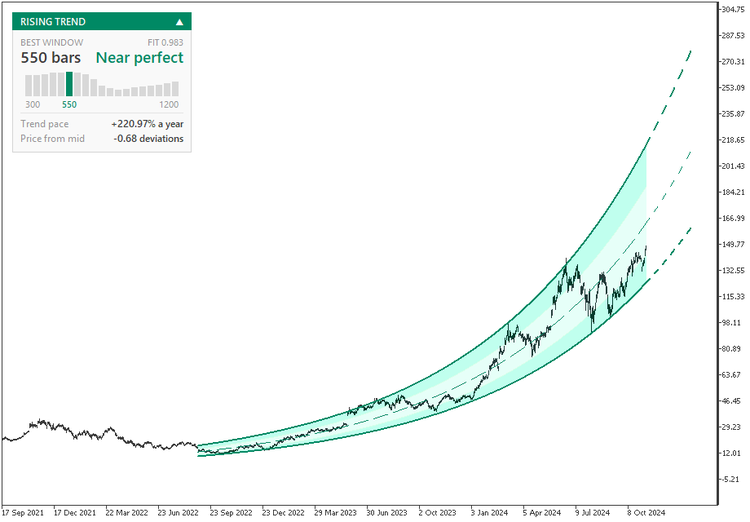
NVDA on the daily chart, from late August 2022 to early November 2024. The indicator searched its long windows, settled on 550 bars with a fit of 0.983, graded Near perfect, and puts the pace of the trend at +220.97% a year. Inside the window the midline climbs from 12.73 to 162.71, almost thirteen times, and only 14 of the 550 daily closes land outside the edges.
A curve where a straight line would miss
Take the halfway point of that window, October 2023. The fitted trend sits near 45 and the upper edge just under 60. A straight line joining the two ends of the midline would pass near 88 on the same day, above the whole channel and nowhere near the candles. That is the gap between a straight channel and the curve on a linear chart, and the more the price multiplies inside the window, the wider it gets.
The edges follow the same logic. Each one sits a fixed number of deviations from the midline in log terms, so the channel widens in price as the trend climbs and narrows as it falls, always the same percentage away from the middle. A 5-dollar swing near 15 and a 50-dollar swing near 150 count as the same move.
It picks the window for you
There is no length to tune. On every closed bar the indicator fits 19 look-back windows, from 20 to 200 bars in steps of 10, or from 300 to 1200 bars in steps of 50 when you switch to the long set, and keeps the one whose log prices line up most closely with a straight trend, measured by correlation. If two windows tie, the shorter one wins. A window longer than the history on your chart, or one holding a price at or below zero, is left out of the search.
The card: how clean, how fast, where price is
A colored band names the direction, RISING TREND or FALLING TREND, and the whole drawing takes that color. Under it, two large figures give the winning window and its grade, one of 13 steps from Negligible to Near perfect, with the exact correlation just above.
Below the figures, 19 small columns show the correlation of every window, the winner highlighted and its length written underneath. They show what a single number cannot: a lone tall column means one horizon stands out, while a broad plateau means the same trend holds from several distances.
Trend pace turns the slope into growth per unit of calendar time, measured from the real time the window spans, so weekends, session breaks and missing bars are counted by the clock, not by the bar count. It reads per day when the window covers less than 20 days, per month up to a year and per year beyond that, on any timeframe. Price from mid gives the distance of the live price from the midline in deviations: -0.68 on the NVDA chart, a little below the middle of the channel.
Zones and projection
The channel is split into zones. The band within one deviation of the midline is light; from there out to the edges the color gets stronger, so a glance tells you whether price is trading in the body of the trend or stretched toward an edge. The edges are solid, the midline dashed, and dashes continue ahead of the bar in progress along the same curve for a fifth of the window, between 6 and 60 bars. The dash length follows the zoom, so the projection reads the same at any scale.
Rising trends are drawn in teal green, falling ones in raspberry, and both colors are inputs. The zones sit behind the candles, and their tint is kept within the tone range of your chart background, so the candles drawn over them stay readable on a white chart as well as a dark one. Change the background and the zones and the card recolor themselves.
Still while the bar forms
Only closed bars are fitted. The channel, the chosen window and the pace stay put while a bar is forming and update once, when it closes. In between, the live price is measured against that fixed channel, so the position on the card and in the buffer moves with every tick while the channel itself holds still.
For Expert Advisors
Six values sit in the Data Window and can be read with iCustom and CopyBuffer. Buffer 6 is the upper edge, 7 the midline, 8 the lower edge and 9 the position in deviations, on every bar of the window and on the bar in progress. Buffer 10 holds the length of the best window and buffer 11 the signed correlation, negative in a falling trend, on the newest closed bar and the bar in progress. Shift 0 gives the live position, shift 1 the last closed bar.
With those numbers an Expert Advisor can trade only when the fit clears a level you choose, look for entries as the position nears an edge in the direction of the trend, or stand aside while the best window keeps jumping from one length to another.
Inputs
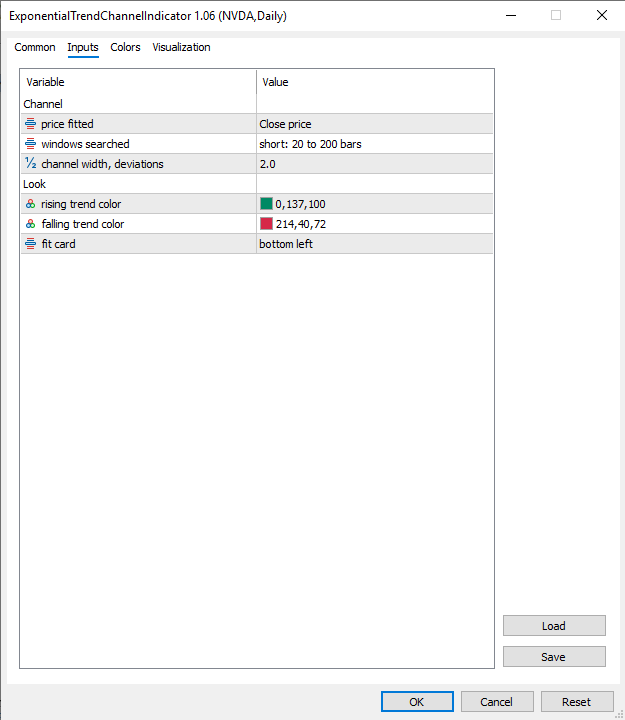
Six settings in two groups.
- Channel: price fitted, close by default, or open, high, low, median, typical or weighted; windows searched, short (20 to 200 bars) or long (300 to 1200 bars); channel width in deviations (2.0), any value above zero.
- Look: rising trend color; falling trend color; fit card, in any of the four corners or switched off (bottom left).
Works on any symbol and timeframe, and removing the indicator deletes everything it drew.
Educational content, not financial advice. Trading involves risk of loss.
High precision tick spread monitor with real time Max and Avg curves for MT4 and MT5.
Real-time tick spread monitor that plots Maximum and Average spread curves per bar with points/pips display and local CSV persistence.
 VrDz Bot Scalp and Swing EA with Always ON Secure Layer Pro Panel
Lightweight Expert Advisor combining Scalp & Swing logic with an "Always-ON" position-securing layer. Includes a fully interactive on-chart panel with manual trade buttons, risk- based lot sizing, partial close, break-even, trailing stop, swing SL/TP switching, and a one-click "Secure All" tool.
 MT5 Risk Reward Calculator
A free MT5 script to calculate position size, risk amount, and risk-to-reward ratio visually on the chart.
MACD Signals
Indicator edition for new platform.