 MetaTrader 5
 Experts
 Indicators
 Scripts
 Libraries
 Storage
Join our fan page

Key Levels with Touch Counter - previous day/week/month highs and lows plus round numbers, with touch and sweep counts - indicator for MetaTrader 5

I build clean, well-tested Expert Advisors and indicators for MetaTrader 4 and 5, with a focus on rule-based strategies and solid risk management.
What I can do for you:
- Views:
- 218
- Rating:
- Published:
-
 You are missing trading opportunities:
- Free trading apps
- Over 8,000 signals for copying
- Economic news for exploring financial markets
Registration Log inYou agree to website policy and terms of use
If you do not have an account, please register -
 Need a robot or indicator based on this code? Order it on Freelance
Go to Freelance

What it does
- Previous day, previous week and previous month high/low (PDH, PDL, PWH, PWL, PMH, PML), taken from the D1, W1 and MN1 series of the symbol. Lines start at the beginning of the current period and extend to the right.
- Round-number levels: InpRoundCount levels above and below the last close. With InpRoundStep = 0 the step is automatic: 1/100 of the power of ten of the price (EURUSD 1.08 gives 0.01, USDJPY 150 gives 1, a gold price of 4000 gives 10, an index at 20000 gives 100). Or enter your own step in price units.
- Each line has a label: tag, price, T = touches, S = sweeps.
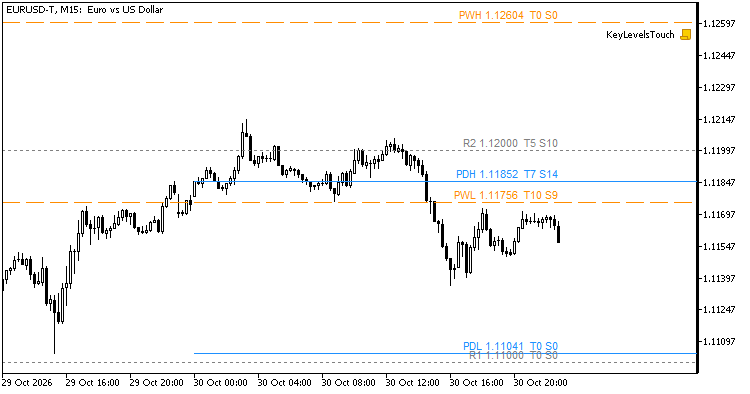
How touches and sweeps are counted (closed bars only)
- A bar touches a level if low <= level + tol and high >= level - tol (inclusive: a bar exactly on the edge of the band counts). Consecutive touching bars count as one touch; a new touch needs at least one bar that did not touch in between.
- A sweep is a bar with high > level + tol and close < level , or low < level - tol and close > level .
- tol = InpTolPoints points, or if that is 0, InpTolATR x ATR( InpATRPeriod ) of the chart timeframe on closed bars.
- Previous day/week/month levels are counted from the start of the current period (day, week or month in broker server time). Round levels are counted over the last InpRoundLookback bars. At most InpMaxScanBars bars are scanned per level.
- Everything is recalculated once per new bar from closed bars; the forming bar is never used.
Alerts
- Sweep alert: the last closed bar swept a level and closed back. Optional touch alert: the last closed bar started a new touch. One evaluation per closed bar; history is not alerted when the indicator is attached.
- Channels: popup, push notification, email, sound file.
Buffers (iCustom)
| Buffer | Content |
|---|---|
| 0-5 | PDH, PDL, PWH, PWL, PMH, PML (price) |
| 6-11 | touch count of the same level |
Read shift 0. The value is calculated at the open of the bar from closed bars only and is not changed afterwards. Older bars keep the values written while they were the current bar, so history from before the indicator was attached is empty ( EMPTY_VALUE ). Plots are DRAW_NONE ; values are visible in the Data Window.
int h = iCustom(_Symbol, PERIOD_M15, "KeyLevelsTouch");
double pdh[1], t[1];
if(CopyBuffer(h, 0, 0, 1, pdh) == 1 && CopyBuffer(h, 6, 0, 1, t) == 1)
   Print("PDH ", pdh[0], " touches ", t[0]);
Notes
- Timeframes above H4 are rejected with a message in the Experts tab.
- Higher-timeframe history must be available in the terminal; if it is not loaded yet when the indicator starts, it retries every 2 seconds (also when no ticks arrive, e.g. at the weekend) until the levels can be drawn.
- Round levels are not exposed in buffers (they change with price).
- Objects use the prefix KLT_ and are removed when the indicator is removed.
- Not financial advice. It marks levels and counts past events; it does not predict anything.
Testing
Checked in the Strategy Tester (EURUSD M15, August-October 2026, broker data). On every bar the six previous day / week / month levels and their touch counts, read live at the open of the bar, were compared with an independent rebuild from the raw rates: all 37,416 level values and all 37,416 touch counts matched. Sweep counts and round-number levels are drawn with the same rule but are not exposed in buffers, so they were checked only visually.
ORB Box + VWAP Stats - opening range box, 1R/2R targets, session VWAP and historical break statistics
Draws the opening range of a configurable session (start time and length in minutes, with a server time zone adjustment), the 1R and 2R levels above and below the box, and the session VWAP (tick volume, or real volume when the broker provides it). A small panel counts, over the last N finished sessions, how many broke the range up only, down only, on both sides, or not at all, and how often price reached 1R and 2R after the first break. The statistics are historical counts: they describe the past and do not predict anything. Only closed bars are used, so nothing repaints; optional popup, push and sound alerts fire once per direction per session when a closed bar closes outside the box. Eight buffers (range, targets, VWAP, break state) can be read from an Expert Advisor with iCustom(). Works on M1 to M30, recalculates only new bars and deletes its chart objects when removed. Read-only: it never trades. No DLLs, no web requests.
Session High Low Alerts - Asia, London and New York session highs and lows with non-repainting break alerts
Draws the high and low of the Asia, London and New York sessions as boxes or lines extended to the end of the day, with configurable session hours and a server time zone adjustment. Optional previous day and previous week high/low. When a CLOSED bar breaks the high or low of a session that has already finished, it can raise a popup alert, a push notification and/or a sound, once per level per day. Alerts are evaluated on closed bars only, so they do not repaint. The 10 levels are exposed in indicator buffers, so an Expert Advisor can read them with iCustom(). It recalculates only new bars, works on any timeframe up to H1, and deletes all its chart objects when removed. Read-only: it never opens, modifies or closes a trade. No DLLs, no web requests.
Accelerator Oscillator (AC)
The Acceleration/Deceleration Indicator (AC) measures acceleration and deceleration of the current driving force.
MACD Signals
Indicator edition for new platform.