 MetaTrader 5
 Experts
 Indicators
 Scripts
 Libraries
 Storage
Join our fan page

HTF Candles (ICT Power of Three) - higher timeframe candles next to your chart - indicator for MetaTrader 5

I build and fix trading tools for MetaTrader 4 and MetaTrader 5:
• Expert Advisors (EAs) built from your strategy rules
• Custom indicators, alerts and on-chart panels
- Views:
- 80
- Rating:
- Published:
-
 You are missing trading opportunities:
- Free trading apps
- Over 8,000 signals for copying
- Economic news for exploring financial markets
Registration Log inYou agree to website policy and terms of use
If you do not have an account, please register -
 Need a robot or indicator based on this code? Order it on Freelance
Go to Freelance
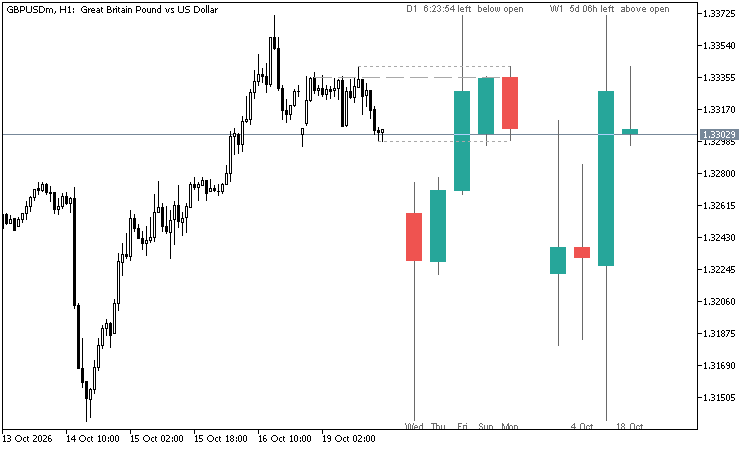
ICT's Power of Three reads every candle as accumulation near the open, manipulation away from it and distribution in the real direction. To see it you need the higher timeframe candle while you trade the lower one. This indicator draws those candles next to your chart at their real prices, so you can watch the 4-hour or daily candle form on a 5- or 15-minute chart.
What it shows
- The last finished candles and the live candle of one or two higher timeframes, to the right of the last bar.
- Auto pairs (or choose your own): M1 -> M15 + H1, M5 -> H1 + H4, M15 / M30 -> H4 + D1, H1 -> D1 + W1, H4 -> W1 + MN, D1 -> MN.
- Above each set: the timeframe, the time left until the live candle closes, and whether price is above or below its open.
- Live candle: dashed lines from its open, high and low back to the chart candle where each one was made.
- The time under each candle (08:00, Mon, 18 Oct, Oct). Labels are skipped when they would overlap.
- Hover a candle to see its open, high, low and close.
- Optional: the previous candle's high and low on the chart.
How it works
- The candles are built from the chart's own candles: open of the first, close of the last, highest high, lowest low. No data of another timeframe has to be loaded. Compared with the broker's own H4, D1, W1 and MN candles: identical.
- Server time: H1 - H12 from the start of the hour, D1 from 00:00, W1 from Sunday, MN from the 1st.
- Candle width and gap are set in pixels, so the candles keep their size when you zoom.
- Chart shift is turned on and widened when the candles need room (input). Your old setting comes back when you remove the indicator.
Alerts
- A new candle of the first higher timeframe.
- A candle closes across the open of that higher timeframe candle.
- Popup, push notification and e-mail.
Buffers for Expert Advisors (first higher timeframe, iCustom, not drawn)
- 0 / 1 / 2: open, high and low of the higher timeframe candle so far (up to and including this chart candle, no look-ahead)
- 3 / 4 / 5: high, low and close of the previous higher timeframe candle
- EMPTY_VALUE when there is none
Example: the last close above buffer 0 = price above the daily open, a common ICT bias filter.
Good to know
- The chart time frame must be D1 or lower and must divide the higher one.
- The indicator only draws and calculates; it never trades.
ICT Premium / Discount and OTE - dealing range, standard deviations, IPDA ranges
ICT dealing range from confirmed swings: premium and discount zones, equilibrium, the OTE band (62 - 79 %, 70.5 %), standard deviation targets and the IPDA 20 / 40 / 60-day ranges. No repaint. Alerts and EA buffers.
Prior Bar Break Odds with Level Bars and a Rolling Hit Rate
Measures, on the chart's own history, how often a bar takes out the prior high or the prior low after bullish and after bearish bars, at up to five levels spaced by the average range. Each level carries a probability bar, and a table scores the favored side over all bars and over the last 200.
Accelerator Oscillator (AC)
The Acceleration/Deceleration Indicator (AC) measures acceleration and deceleration of the current driving force.
MACD Signals
Indicator edition for new platform.