 MetaTrader 5
 Experts
 Indicators
 Scripts
 Libraries
 Storage
Join our fan page

Volatility-Adjusted Momentum Decay Line - indicator for MetaTrader 5

- Views:
- 107
- Rating:
- Published:
-
 You are missing trading opportunities:
- Free trading apps
- Over 8,000 signals for copying
- Economic news for exploring financial markets
Registration Log inYou agree to website policy and terms of use
If you do not have an account, please register -
 Need a robot or indicator based on this code? Order it on Freelance
Go to Freelance
Need a robot or indicator based on this code? Order it on Freelance
Go to Freelance
The idea behind it
Most momentum indicators use a fixed lookback and a fixed smoothing constant, which means a 10-bar momentum reading behaves the same whether the market is drifting quietly or whipping through a news spike. The Volatility-Adjusted Momentum Decay Line (VAMD) starts from a simple raw momentum reading — the change in close price over InpMomentumPeriod bars — and divides it by the current ATR so the reading is expressed in volatility units rather than price units. That normalized momentum is then fed into a recursive decay filter: on every bar, the line moves a fraction of the way from its previous value toward the new normalized momentum, and that fraction — the decay rate — is not fixed. It is scaled by the ratio of the current ATR to its own moving average over InpATRAvgPeriod bars. When volatility is running above its recent baseline, the decay rate speeds up and the line snaps toward fresh momentum readings; when volatility compresses back to baseline, the decay rate slows down and the line holds its position longer, acting almost like a built-in memory of the prior move.
The result behaves less like a classic oscillator and more like a momentum reading that "forgets" faster during volatility expansions and "remembers" longer during quiet stretches. It is built for instruments and timeframes where volatility regimes shift visibly within a session, such as EURUSD or GBPUSD on an M15 chart, where a London-session expansion followed by a quiet Asian range is common. A separate indicator subwindow below the price chart keeps the oscillator visually distinct from price action.
How to interpret it
- Decay Line (main plot) — the single colored line in the subwindow. It oscillates around a zero level; sustained moves away from zero indicate momentum that volatility conditions are not yet pulling back down, while a line hugging zero indicates momentum has already decayed out or the market has no clear directional push.
- ATR-relative decay rate — the internal mechanism that scales how quickly the line reacts. It is never plotted directly, but it is what makes the line snap faster during the gray-shaded volatile stretch in the example figure and settle more slowly during the calmer stretches on either side.
- Color / sign state — the line is drawn in one shade when its value is at or above zero and a second, lighter shade when it drops below zero, making regime flips (bullish momentum decaying into bearish, or vice versa) visually immediate without reading exact values.
- Practical usage — in trend-following use, a Decay Line that stays firmly on one side of zero through a volatility expansion suggests the move has real follow-through, since the faster decay rate would have pulled a weak reading back to zero already. In mean-reversion use, a Decay Line that spikes away from zero and then decays rapidly back through it during a volatile patch can mark exhaustion of a short-term push, since the adaptive decay is actively working against the extended reading.
External variables (inputs)
| Input | Default | Purpose |
|---|---|---|
| InpMomentumPeriod | 10 | Lookback, in bars, used to compute the raw price momentum before volatility normalization. |
| InpATRPeriod | 14 | Period for the ATR used as the volatility unit that normalizes raw momentum into a dimensionless reading. |
| InpATRAvgPeriod | 50 | Period for the ATR's own moving average, which defines the volatility baseline the current ATR is compared against to size the decay rate. |
| InpBaseDecay | 0.15 | Base decay coefficient applied when current ATR equals its baseline; controls how fast the line relaxes toward zero under normal conditions. |
| InpMaxDecay | 0.90 | Hard ceiling on the decay rate, preventing the line from becoming unstable or purely reactive during extreme volatility spikes. |
Recommended use
Load VAMD in its own subwindow beneath the price chart and watch it alongside a volatility reference, such as the ATR panel most traders already keep visible, since the two reinforce each other: a VAMD reading that stays extended while ATR is climbing is a stronger signal than the same extension during a flat ATR. On lower timeframes (M5–M15) the default settings react within a session; on H1 and above, widening InpATRAvgPeriod to 80–100 gives the volatility baseline more bars to stabilize before it starts driving the decay rate. Combine VAMD with a basic price-action filter — support/resistance levels or a simple trend moving average — rather than trading its zero-line crosses in isolation, since the adaptive decay is designed to describe how momentum is fading, not to generate standalone entry signals.
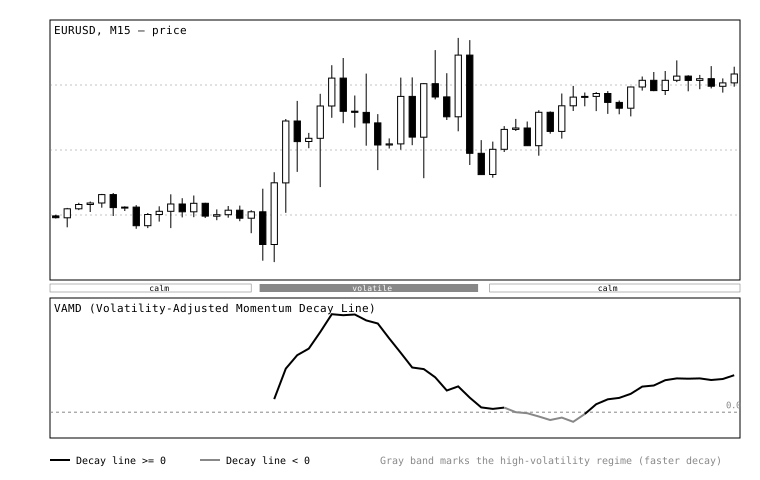
Fig. 1. EURUSD M15 with the VAMD subwindow below price. The gray band under the price panel marks a volatility-expansion stretch; note how the Decay Line accelerates its moves and crosses the zero level (dotted) faster inside that band, then settles into slower, longer-held readings once volatility compresses back to baseline on either side. The line is drawn in black above zero and gray below it.
Simple Anchored VWAP - Institutional Volume Benchmark
Clean and efficient Anchored VWAP (AVWAP) indicator for MetaTrader 5. Calculates volume-weighted average price from a user-defined anchor date with optional volatility standard deviation bands.
Market Structure from Pullback Swings — BOS, CHoCH, IDM
Smart Money Concepts market structure on pullback swings: trend, BoS, CHoCH, IDM and liquidity sweeps. A level counts as taken only on a close — a wick through it is marked as a sweep (x) and relocates the swing. Self-contained, closed bars only.
Accelerator Oscillator (AC)
The Acceleration/Deceleration Indicator (AC) measures acceleration and deceleration of the current driving force.
MACD Signals
Indicator edition for new platform.