 MetaTrader 5
 Experts
 Indicators
 Scripts
 Libraries
 Storage
Join our fan page

Market Structure from Pullback Swings — BOS, CHoCH, IDM - indicator for MetaTrader 5

I build trading software for MetaTrader 4 and MetaTrader 5: Expert Advisors, custom indicators and graphical trade panels. Describe your idea and I will turn it into working, documented code.
WHAT I BUILD
- Views:
- 90
- Published:
-
 You are missing trading opportunities:
- Free trading apps
- Over 8,000 signals for copying
- Economic news for exploring financial markets
Registration Log inYou agree to website policy and terms of use
If you do not have an account, please register -
 Need a robot or indicator based on this code? Order it on Freelance
Go to Freelance
Need a robot or indicator based on this code? Order it on Freelance
Go to Freelance
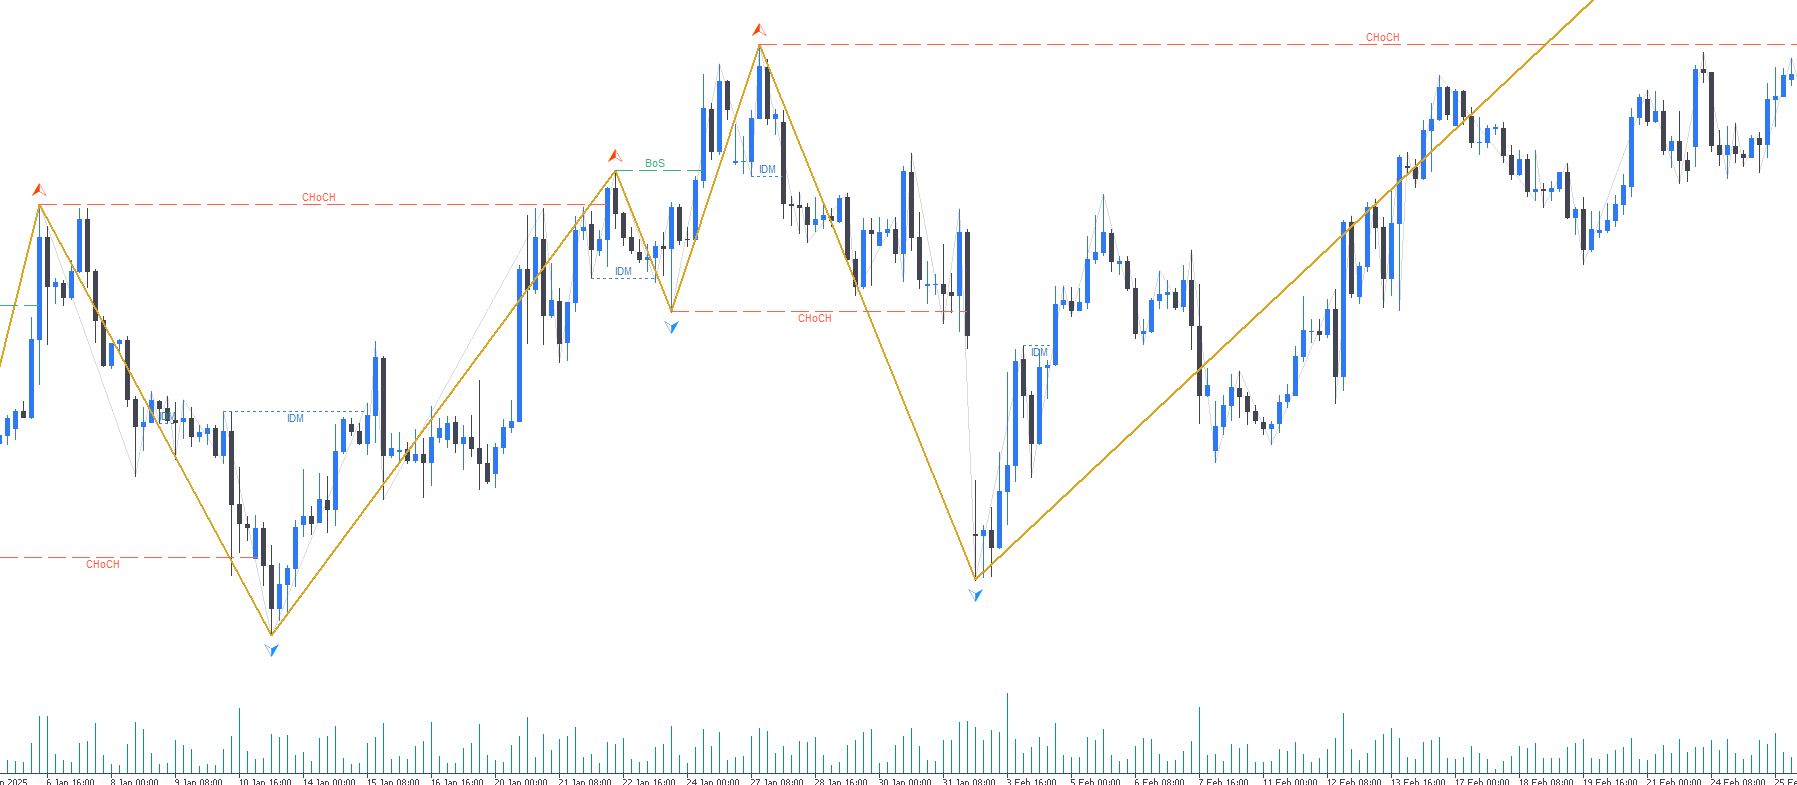
My previous CodeBase entry, SMC Pullback Indicator, answered one question: which highs and lows actually matter? It stopped there deliberately, and the description said as much — no HH/HL labels, no BoS, no CHoCH, no IDM. Those are separate steps that need a reliable set of swings first.
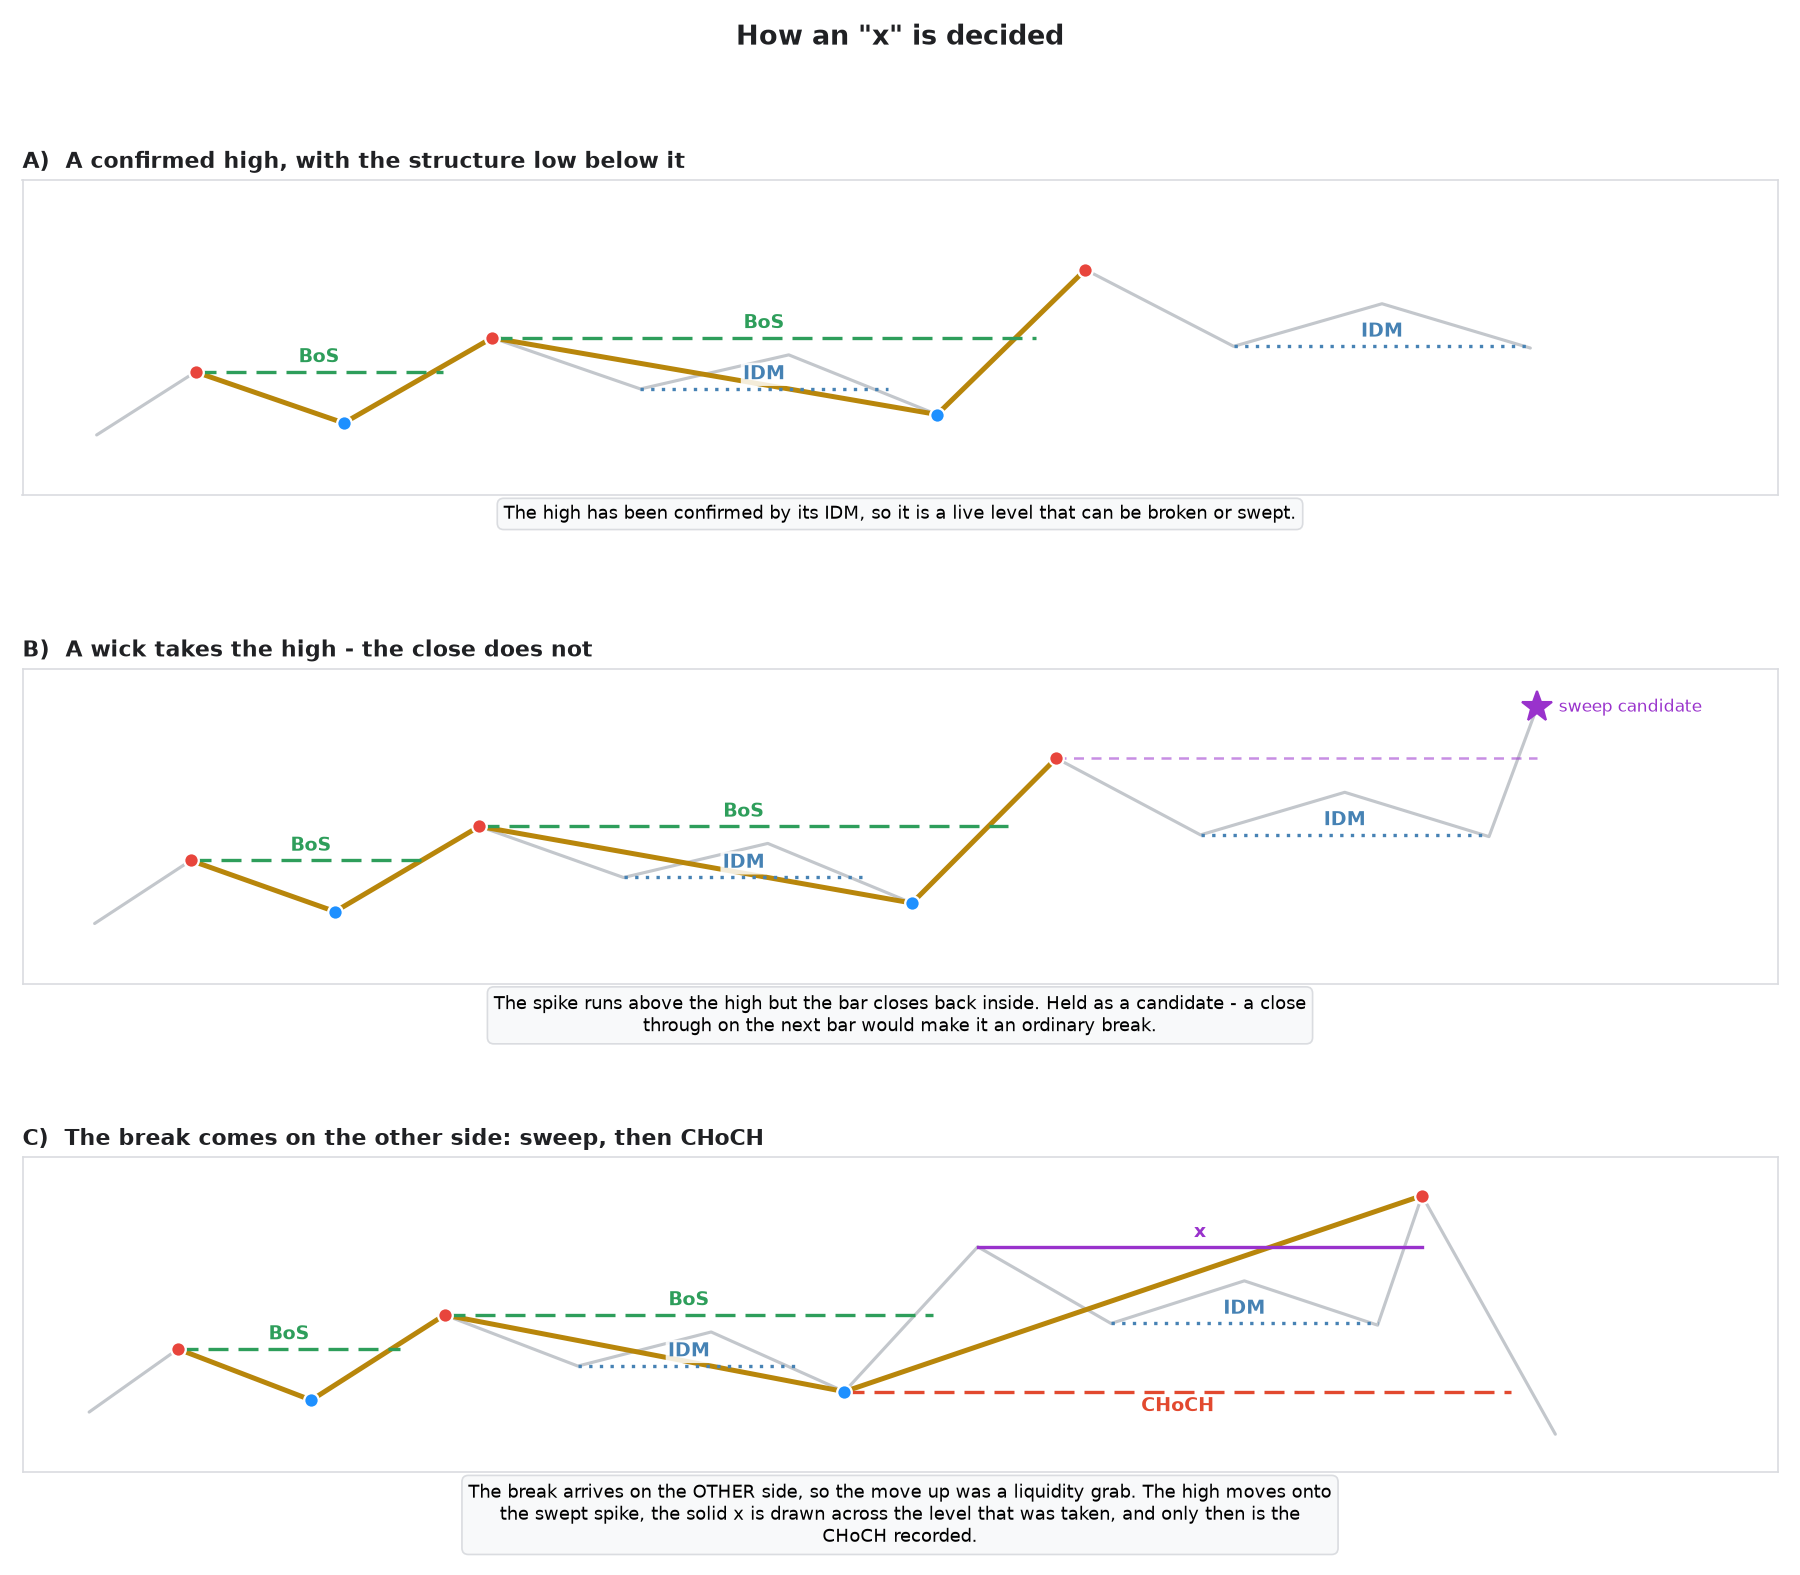
This indicator is that next step. It marks market structure the way Smart Money Concepts (SMC) describes it, and it takes the same pullback detector — the class is included here unchanged, so the file stands alone with no dependency to install — and builds market structure on top of it: a trend, one live high, one live low, and the four events that move them. BoS, CHoCH, IDM and the liquidity sweep marked x.
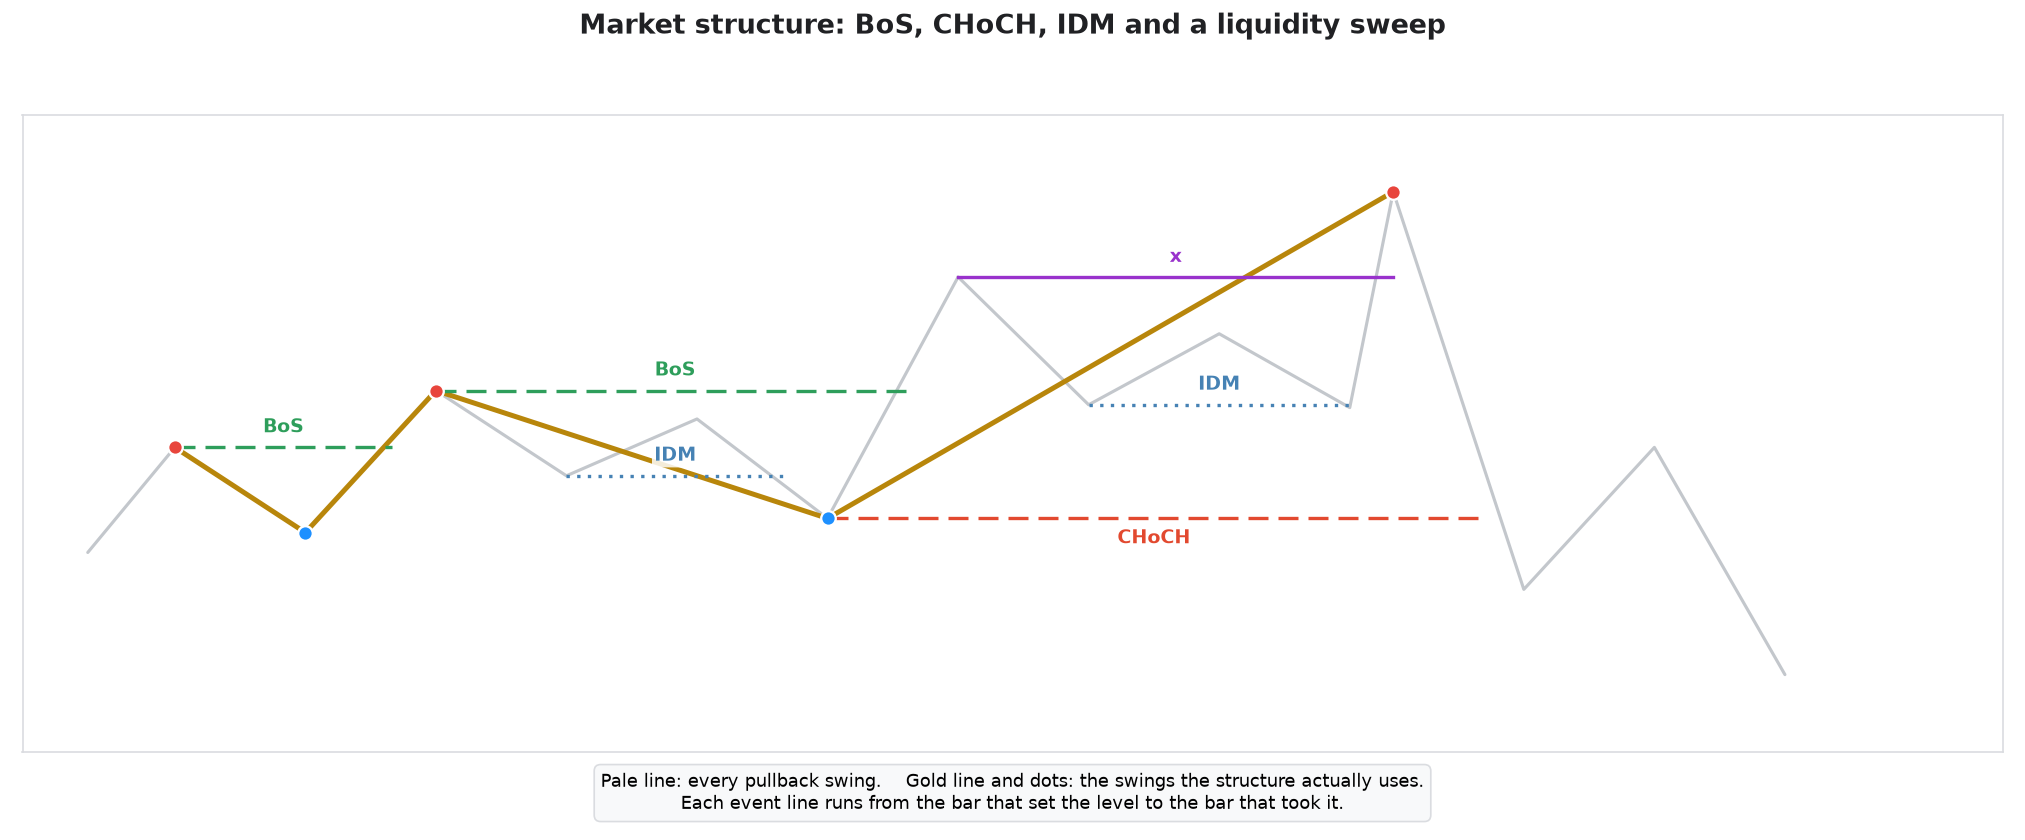
What you see on the chart
| Element | Appearance | Meaning |
|---|---|---|
| Pullback zig-zag | thin pale line | Every swing found by the pullback rule. This is the raw material, deliberately faint — it is context, not signal. |
| Structure zig-zag | thick gold line | Only the highs and lows that the structure actually uses. A small subset of the pale one. |
| Structure markers | arrows above / below | The structure high and low themselves. |
| BoS | dashed, green | Break of Structure — the level was taken with the trend. |
| CHoCH | dashed, red | Change of Character — the level was taken against the trend. The trend flips here. |
| x | solid, purple | Liquidity sweep — the level was taken by a wick only, and price then went the other way. |
| IDM | dotted, blue | Inducement — the pullback level whose break confirms a new structure extreme. |
Each event line is horizontal and spans from the bar that set the level to the bar that took it, so the length of the line tells you how long that level survived.
Layer one: the pullback swings
Briefly, because it is documented in full in the previous entry: a high becomes a swing only once price trades back through the low of the candle that made it. Nothing is decided by shape — a swing is an event, not a geometry, and that is what lets it carry a timestamp.
Two properties of that layer matter downstream:
- The output strictly alternates high, low, high, low. Never two highs in a row.
- A swing is confirmed later than the candle it sits on. The structure layer only ever sees a pullback once it is final, which is why the structure can never be built on a swing that is still provisional.
Both layers are driven one closed bar at a time, pullback first, structure second — so when the structure evaluates a bar, it already knows about any swing confirmed on that same bar.
Layer two: the structure
The structure holds exactly three things:
| State | Meaning |
|---|---|
| Trend | None, Up or Down |
| Structure high | the one high that currently matters — the level whose break is bullish |
| Structure low | the one low that currently matters — the level whose break is bearish |
It is seeded from the first pullback high and the first pullback low, with the trend set to None. From that moment on, the pullback layer never writes into the structure again — it only supplies the reference levels described further down.
The break rule: close takes, wick sweeps
This single distinction produces three of the four event types:
A level is broken only when a candle closes beyond it. A candle whose wick alone goes beyond it has swept it.
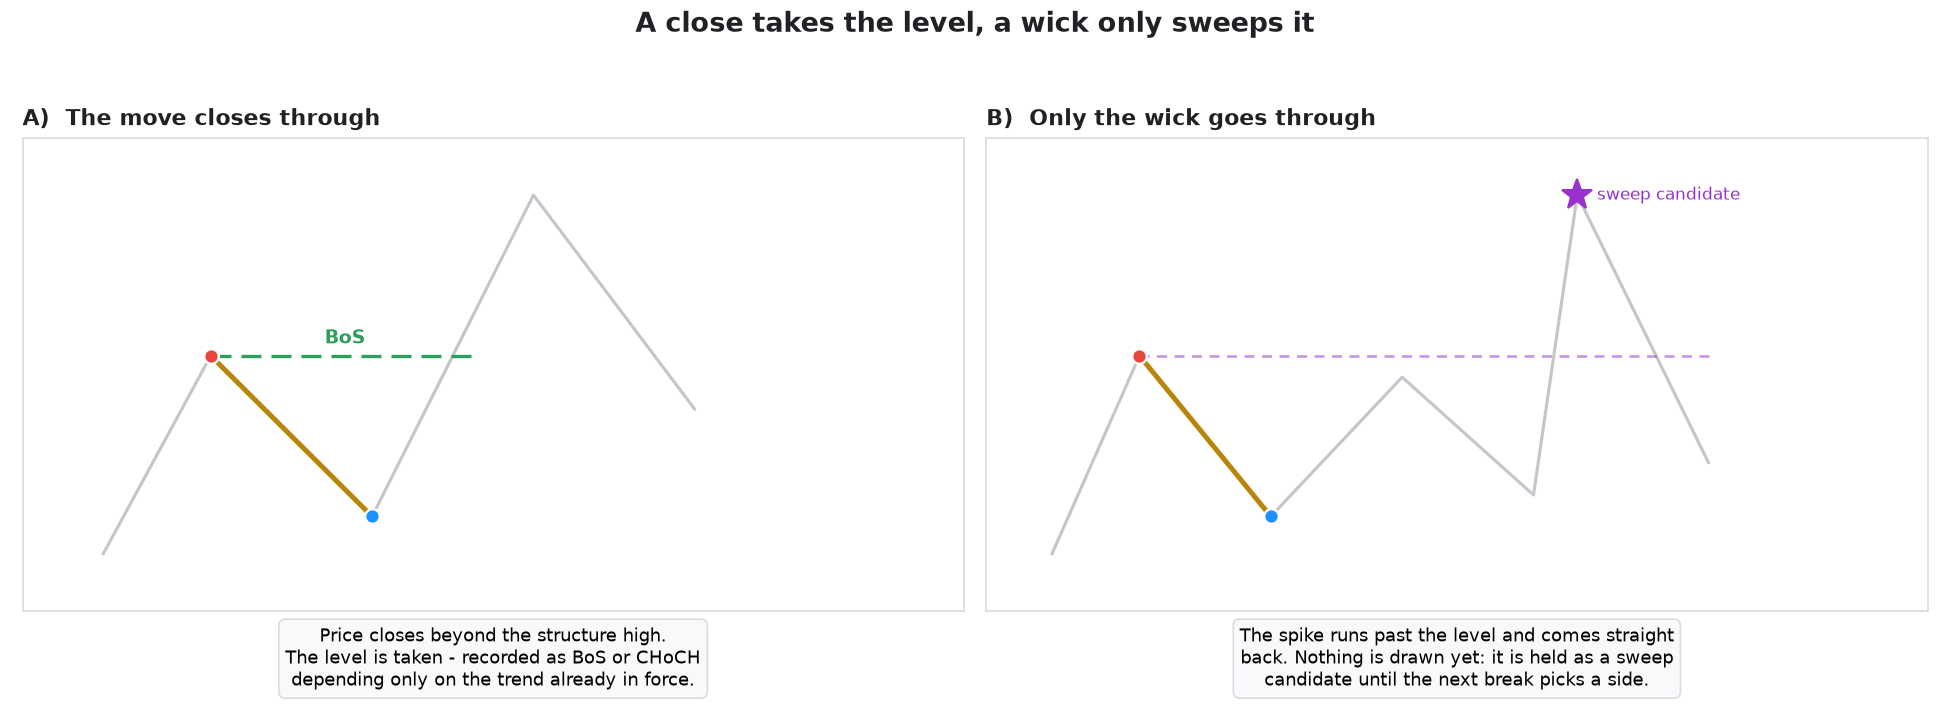
So for every closed candle, with the trend and the two levels as they stand:
| Trend | What the candle did | Event |
|---|---|---|
| None | closed above the high / below the low | BoS — the trend becomes Up / Down |
| Up | closed above the structure high | BoS — continuation, trend stays Up |
| Up | closed below the structure low | CHoCH — trend flips to Down |
| Down | closed below the structure low | BoS — continuation, trend stays Down |
| Down | closed above the structure high | CHoCH — trend flips to Up |
| any | wick beyond a level, close back inside | sweep candidate — remembered, nothing drawn yet |
| any | stayed inside both levels | nothing |
So BoS and CHoCH are the same event — a close through a level. The only thing that decides the label is whether the break agrees with the trend that is already in force. With no trend yet, the first break is a BoS by definition, because there is no character to change.
The sweep: when a wick becomes an x
A wick through a level is not an event on its own. It is recorded and left pending, because at that moment it is ambiguous — price may simply close through the level on the next candle, in which case it was an ordinary break in the making, not a sweep.
It becomes an x only when the next break happens on the opposite side. The classic sequence, in an uptrend:
- Price runs above the structure high with a wick, but closes back below it. Recorded as a sweep candidate. Nothing on the chart.
- Price turns and closes below the structure low.
- That resolves the ambiguity. The move up was a liquidity grab, so the indicator moves the structure high onto the swept candle — the marker and both zig-zag legs follow it — draws the solid x line, and only then records the CHoCH.
Moving the high is the point of the whole exercise. The swing that the reversal started from is the sweep candle, not the older high that it ran through, and every level you derive afterwards should be measured from there.
The x line spans from the bar that set the level to the bar whose wick took it, drawn at the old level's price — that is the liquidity that was resting there. The bearish case is the exact mirror: a wick below the structure low, then a close above the structure high.
Three rules keep this honest:
- If several candles wick through the level, the furthest one wins.
- If price later closes through the level in the same direction, that is an ordinary break and the sweep candidate is discarded.
- A sweep candidate is discarded as soon as any new structure point is published. Once the structure has moved on, an older wick is stale and must not retroactively relocate a point.
IDM: confirming the new extreme
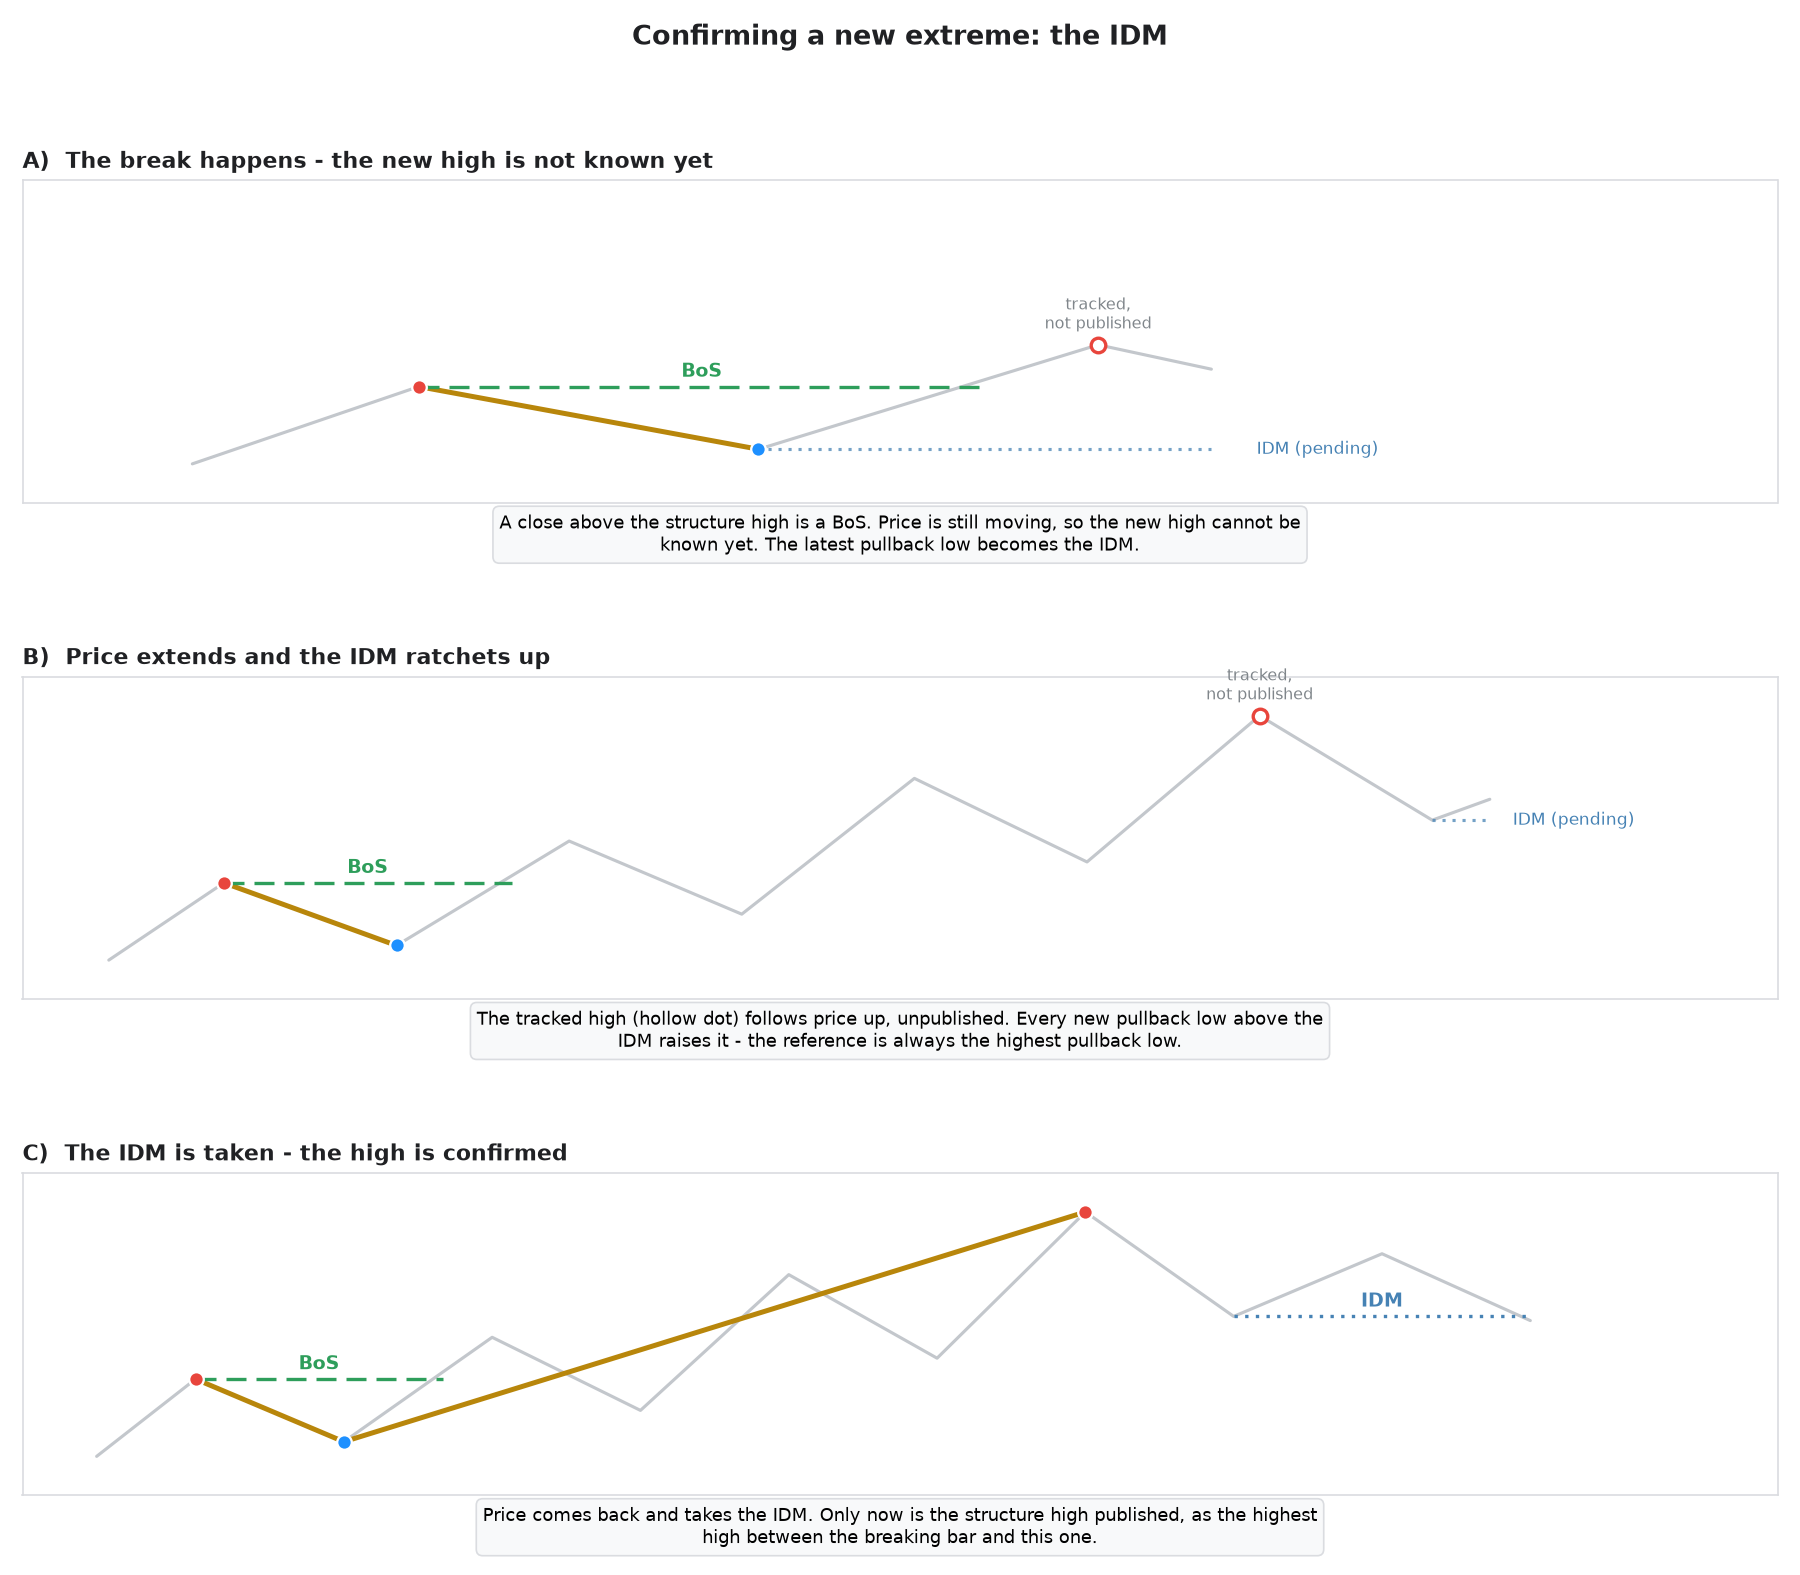
A break answers one question and opens another. When price closes above the structure high in an uptrend, you know a BoS happened — but you do not yet know where the new high is. Price is still moving. Calling the breaking candle the new high would be wrong the moment the next candle goes higher.
The inducement is the answer. At the moment of the BoS:
- The latest pullback low becomes the reference — the IDM.
- Price continues up; the indicator tracks the highest high it reaches, but publishes nothing.
- Each time a new pullback low forms above the current IDM, the IDM ratchets up to it. The reference is always the highest pullback low seen since the break.
- When price finally comes back and takes the IDM, the new structure high is confirmed: it is the highest high between the breaking candle and the candle that took the IDM.
At that moment the dotted IDM line is drawn — from the pullback that set it, across to the candle that ran through it — and the structure high marker appears. The two always come together, which makes the IDM line a useful audit of the logic: every structure high should have an IDM line ending on the bar where its marker appears.
The bearish case is the mirror: after a bearish break the IDM is the lowest pullback high, and taking it confirms the new structure low as the lowest low of the move.
While an extreme is pending, its own side of the structure holds no level, so only the opposite side can be broken. This falls out of the design rather than needing a rule: the IDM always sits at or above the structure low, so price has to take the IDM — confirming the high — before it can reach the low.
Keeping the chain a zig-zag
Structure points must alternate, exactly like the pullback layer. Two highs in a row is a broken chain, not a structure.
A bullish break is on its way to publishing a high. If the newest point in the chain is already a high, a low is missing between them, so the indicator takes the lowest low between that high and the breaking candle and publishes it first. If the newest point is already a low, the chain alternates and nothing is inserted.
That one rule covers every case: your BoS in an established trend, your CHoCH, and the very first break after the seed. The bearish case is the mirror — the highest high of the swept range.
Edge cases, stated openly
| Situation | How it is resolved |
|---|---|
| One candle both takes the IDM and closes through the opposite level | Read in that order: the extreme is confirmed first, then the break is recorded. This is precisely the sweep-then-CHoCH case, and the order matters. |
| A pending extreme is never confirmed, because price breaks the other way first | The tracked extreme is published where it stands, then the break is processed. Nothing is lost and the chain still alternates. |
| The breaking candle itself returns to the IDM | Confirmation can never happen on the breaking candle. The earliest it can occur is the following bar. |
| No pullback exists yet to serve as the IDM | The current structure level on that side is used instead. This only happens on the oldest bars of the chart. |
On repainting — read this before using it
The pullback layer does not repaint, and nothing has changed about it.
The structure layer does, and it is not a defect — it is what the method is. Two things move:
- A pending extreme moves as price extends, right up until the IDM is taken. It is published live so you can see the structure forming, instead of waiting in the dark.
- A sweep relocates a point backwards, by design. That is the whole purpose of the x.
Once an extreme is confirmed by its IDM and no sweep is pending against it, it is settled. Events — BoS, CHoCH, x, IDM — are append-only and never move.
If you build on this, treat a structure point as provisional until its IDM line exists, and treat the events as the stable record. Only closed candles are evaluated; the forming candle is ignored entirely.
Inputs
Pullback layer
| Input | Default | What it does |
|---|---|---|
| Start by looking for | Looking for a swing high | Which side the very first leg searches for. Only affects the oldest bars on the chart. |
| Pullback break confirmed by | Wick | The sensitivity control for the whole indicator. Wick is the literal Trading Hub rule. Close gives fewer, larger pullbacks — and therefore fewer, larger structure moves. Switch to it on M1–M15 or on noisy symbols such as gold and index CFDs. |
Market structure
| Input | Default | What it does |
|---|---|---|
| Extreme confirmed when reference is | Wick | How the IDM must be taken. Wick means touched; Close requires a close through it, which confirms extremes later but filters out shallow pokes at the inducement. |
| Detect liquidity sweeps | true | Turn off for plain structure: levels are then taken by close only, no x, and points are never relocated. Useful for comparing the two readings side by side. |
There is no period, depth or sensitivity setting anywhere — the structure has no parameters of its own. If you want larger structure, raise the timeframe or switch the pullback rule to Close.
Display
| Group | What it controls |
|---|---|
| Pullback zig-zag | The faint underlying swings — colour, style, width, or off entirely. |
| Structure zig-zag | The gold structure line. |
| Structure markers | Arrows on the structure high / low: Wingdings codes and pixel distance from the bar. The buffers stay filled when the arrows are off, so iCustom still sees everything. |
| Break lines | A separate colour for BoS, CHoCH, x and IDM, plus line width and the captions. Turn the captions off on dense charts and keep the colours as the key. |
Alerts
Popup and push notification on a structure event. They fire only on live updates, never while history loads, and only once per event.
Using it from an EA
Five buffers. The empty value is 0.0.
| Buffer | Contents |
|---|---|
| 0 | price of a structure high |
| 1 | price of a structure low |
| 2 | trend on every bar: 1 up, -1 down, 0 none |
| 3 | price of a confirmed pullback high |
| 4 | price of a confirmed pullback low |
int h = iCustom(_Symbol, _Period, "SMC_MarketStructure");
double trend[];
CopyBuffer(h, 2, 0, 1, trend);   // 1 = up, -1 = down, 0 = none
Buffer 2 is filled on every bar including the forming one, so reading it at shift 0 always returns the current trend. The other four are sparse by nature.
Both engines are self-contained classes with no buffer or chart dependencies — CPullbackDetector takes price arrays and reports confirmed swings, CMarketStructure takes bars plus those swings and reports a point chain and an event list. Both can be copied straight into an EA if you would rather not go through iCustom, which also gives you the events — they are not exposed through buffers.
What it deliberately does not do
It stops at structure. No order blocks, no fair value gaps, no premium/discount zones, no entries and no HH/HL/LH/LL labelling. Those all need a dependable trend and a dependable pair of levels first — which is what this provides, with every decision it makes visible on the chart as a line you can check.
QCL Heikin Flow MT5
QCL Heikin Flow applies two-stage smoothing to Heikin Ashi candles, helping traders filter price noise and visualize trend direction. Features adjustable smoothing periods, four moving average methods, and customizable candle colors.
 EMA Cross Scalper M15 (XAUUSD, WIB session filter)
EMA(10) x EMA(30) scalper for XAUUSD on the M15 timeframe with a Jakarta session filter. Educational example: fixed lot size, SL/TP in points, maximum of 1 position, spread filter. Tested on 100% real ticks.
Accelerator Oscillator (AC)
The Acceleration/Deceleration Indicator (AC) measures acceleration and deceleration of the current driving force.
MACD Signals
Indicator edition for new platform.