Watch how to download trading robots for free
Find us on Twitter!
Join our fan page
Interesting script?
So post a link to it -
let others appraise it
You liked the script? Try it in the MetaTrader 5 terminal
Indicators

ICT Structure Visualizer – liquidity sweep, MSS and FVG with an honest statistics panel - indicator for MetaTrader 5

Cristian Ciunae
Cristian Ciunae
MQL5 developer specialized in ICT / Smart Money Concepts trading systems: liquidity sweep entries, order blocks, market structure shifts and session-based logic. I build complete Expert Advisors with strict prop-firm risk management (FTMO-style daily and max drawdown protection). Clear
Views:
477
Rating:
(1)
Published:
MQL5 Freelance Need a robot or indicator based on this code? Order it on Freelance Go to Freelance
What it is

A chart tool for traders who study the ICT / Smart Money sequence and want to see, on their own symbol and timeframe, what it actually produces. It does not open trades and it does not promise a result.

What it draws

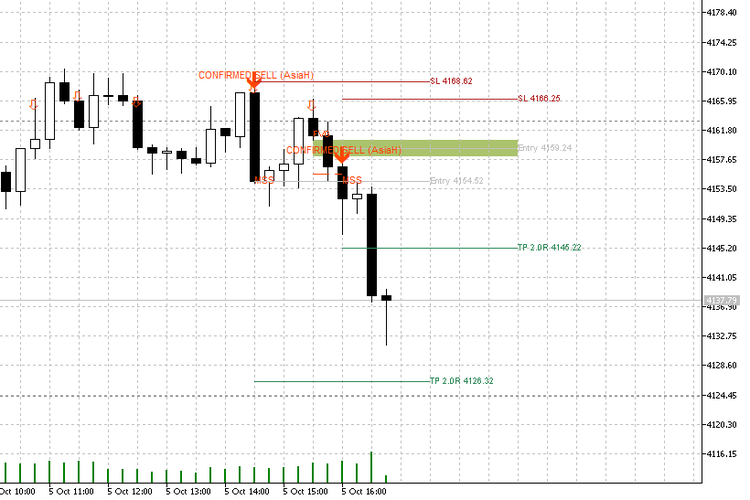
- Liquidity pools: previous day high / low and Asia session high / low
- Liquidity sweep: a pool is taken and the candle closes back inside
- MSS: opposite structure broken by a displacement candle (size in ATR)
- FVG left by the displacement, as a soft-tinted rectangle
- Entry arrow with status WATCHING / CONFIRMED

No repainting

Every object is created from closed bars only and is never moved afterwards. When the chart is fully recalculated (new settings, history reload) all objects are removed and rebuilt from the same closed bars, so they come back identical. With "Log signals" enabled, every signal is written to a CSV file at the moment it appears, so you can check this yourself.

Trade plan and statistics

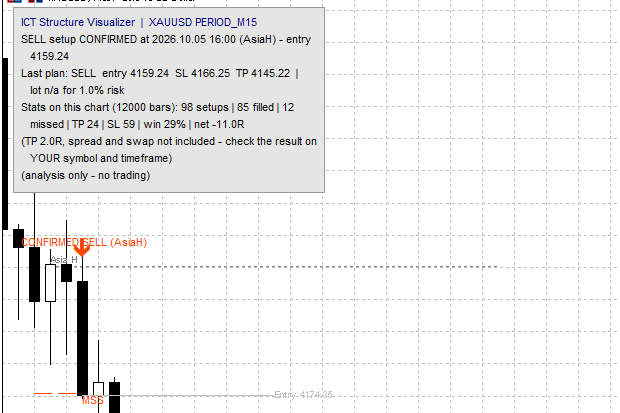
For every confirmed setup the indicator draws entry (middle of the FVG), stop loss (beyond the sweep extreme) and take profit (x times the risk), and shows the lot size for your risk %. Each plan is then followed bar by bar: TP, SL, or "missed" if price never reached the entry. When TP and SL are touched in the same bar it is counted as SL.

The panel shows the result of all setups on the current chart: setups, filled, missed, TP, SL, win rate and net R. Spread, commission and swap are not included.

Volume context

At every sweep the indicator shows relative volume (vs. the average of the last N bars) and tick delta, plus the previous day POC. Important: CFD brokers provide tick volume, not exchange contracts, and most do not mark ticks as buy or sell. The indicator labels this as "tick volume" / "tick delta" and never presents it as real order flow.

Export

"Write every setup + outcome" saves every setup and its result to a CSV file in MQL5/Files, so you can analyse the setups in Excel. The file is written on a normal chart; in the Strategy Tester it is not written.

Our own test – published as it is

We ran the indicator on IC Markets data, M15, with default settings except "Bars to process" = 100000:

XAUUSD (Jul 2022 – Oct 2026): 1220 closed setups, win rate 33.9%, net +22R before costs, about 0R after spread + commission
EURUSD (Sep 2022 – Oct 2026): 1397 closed setups, win rate 33.7%, net +16R before costs, -75R after spread + commission

Costs: commission 7 USD per lot round trip; spread taken from the broker's bar history, where it is often recorded as 0 – so the real cost is probably higher than shown.

With TP = 2R the break-even win rate is 33.3%. On this data the sequence sweep → MSS → FVG, used mechanically, did not give an edge after costs, and the winning direction changed from year to year with the trend.

Volume filter (only tested on 6 months, April – October 2026, M15): with "minimum sweep volume" = 1.5, XAUUSD went from -15R to -7R (fewer setups, still negative) and EURUSD from +26R to +7R. No consistent improvement.

That is why this is a free study tool, not a signal product. Use it to see the structure clearly, to test your own filters and rules on your own symbol and timeframe, and to keep a record of what really happens – before you risk money on it.

Recommended use

- Chart: M5 or M15
- Set "Bars to process" higher (for example 12000 or more) for a statistic with enough setups
- Read the panel together with your costs: spread and commission matter a lot when the stop is small

Main inputs

- Liquidity pools: previous day high/low, Asia session hours (server time)
- Sweep and structure: swing length, max bars to MSS, displacement size in ATR
- Display: pool lines, FVG fill strength, labels, panel (position and font size), alerts (popup / push / e-mail)
- Volume context: relative volume, tick delta, minimum sweep volume (0 = off), POC
- Trade plan and statistics: RR, risk %, SL buffer, entry expiry, statistics on/off
- Proof / documentation: CSV export

Version history

- 1.24 – the panel is a box with its own background, readable on any colour scheme; it can be placed in any chart corner, with adjustable font size
- 1.23 – a plan is created only when the stop loss is on the correct side of the entry
- 1.22 – CSV export works on a normal chart (no Strategy Tester needed)
- 1.21 – CSV export (plus an experimental screenshot option, off by default)
- 1.20 – volume context: relative volume, tick delta, previous day POC
- 1.10 – trade plan, statistics panel, push / e-mail alerts
- 1.01 – soft FVG fill, text labels, signal log
- 1.00 – first version
ATS Prop Rules Monitor - prop firm challenge scoreboard with the room left on every rule ATS Prop Rules Monitor - prop firm challenge scoreboard with the room left on every rule

One panel for the rules of a prop firm challenge: daily loss, maximum loss (static or trailing), profit target, minimum trading days and the best-day (consistency) rule. For each one it shows how much is used and how much room is left, in money. "One more trade" tells you the largest lot size that still keeps a stop-out inside the room left today and in the max-loss room. Read-only: it never opens, changes or closes a trade. The presets hold typical values; firms change their rules, so check yours and use the Custom preset. Built on the ATS Risk Library (ATS_RiskLib.mqh, included).

ATS Risk Library - lot size from the stop, daily loss, drawdown and exposure guards ATS Risk Library - lot size from the stop, daily loss, drawdown and exposure guards

A small include file for Expert Advisors and trade managers. It turns your risk rules into yes/no answers: how many lots does this stop allow, is the daily loss limit reached, is the maximum drawdown (static or trailing) reached, how much is at risk across all open positions, and are spread and session acceptable. The lot is never rounded up: if the broker minimum lot would risk more than allowed, the trade is skipped and the reason is returned. Limits survive a terminal restart. The library only measures: it sends no order. Includes a demo account guard (no trading by default) and a self-test with 78 checks.

Newtonian Mechanics Newtonian Mechanics

A MetaTrader 5 utility that treats the bid and ask quote streams as two independent physical trajectories and fits a local quadratic to each, producing position, velocity, and acceleration with honest error bars and an out-of-sample forecast scoreboard.

Advanced Prop-firm Trade Panel based on S-R Advanced Prop-firm Trade Panel based on S-R

A manual trading panel with a built-in prop-firm risk guard and a hidden Support/Resistance finder for MetaTrader 5.