 MetaTrader 5
 Experts
 Indicators
 Scripts
 Libraries
 Storage
Join our fan page

Market Replay Tool - expert for MetaTrader 5

- Views:
- 1643
- Rating:
- Published:
- Updated:
-
 You are missing trading opportunities:
- Free trading apps
- Over 8,000 signals for copying
- Economic news for exploring financial markets
Registration Log inYou agree to website policy and terms of use
If you do not have an account, please register -
 Need a robot or indicator based on this code? Order it on Freelance
Go to Freelance
Need a robot or indicator based on this code? Order it on Freelance
Go to Freelance
How to Use
1. Initialization Attach the EA to your normal chart (e.g., BTCUSD). The EA will automatically create and load a custom replay symbol (e.g., BTCUSD _REPLAY ). Open this new custom chart.
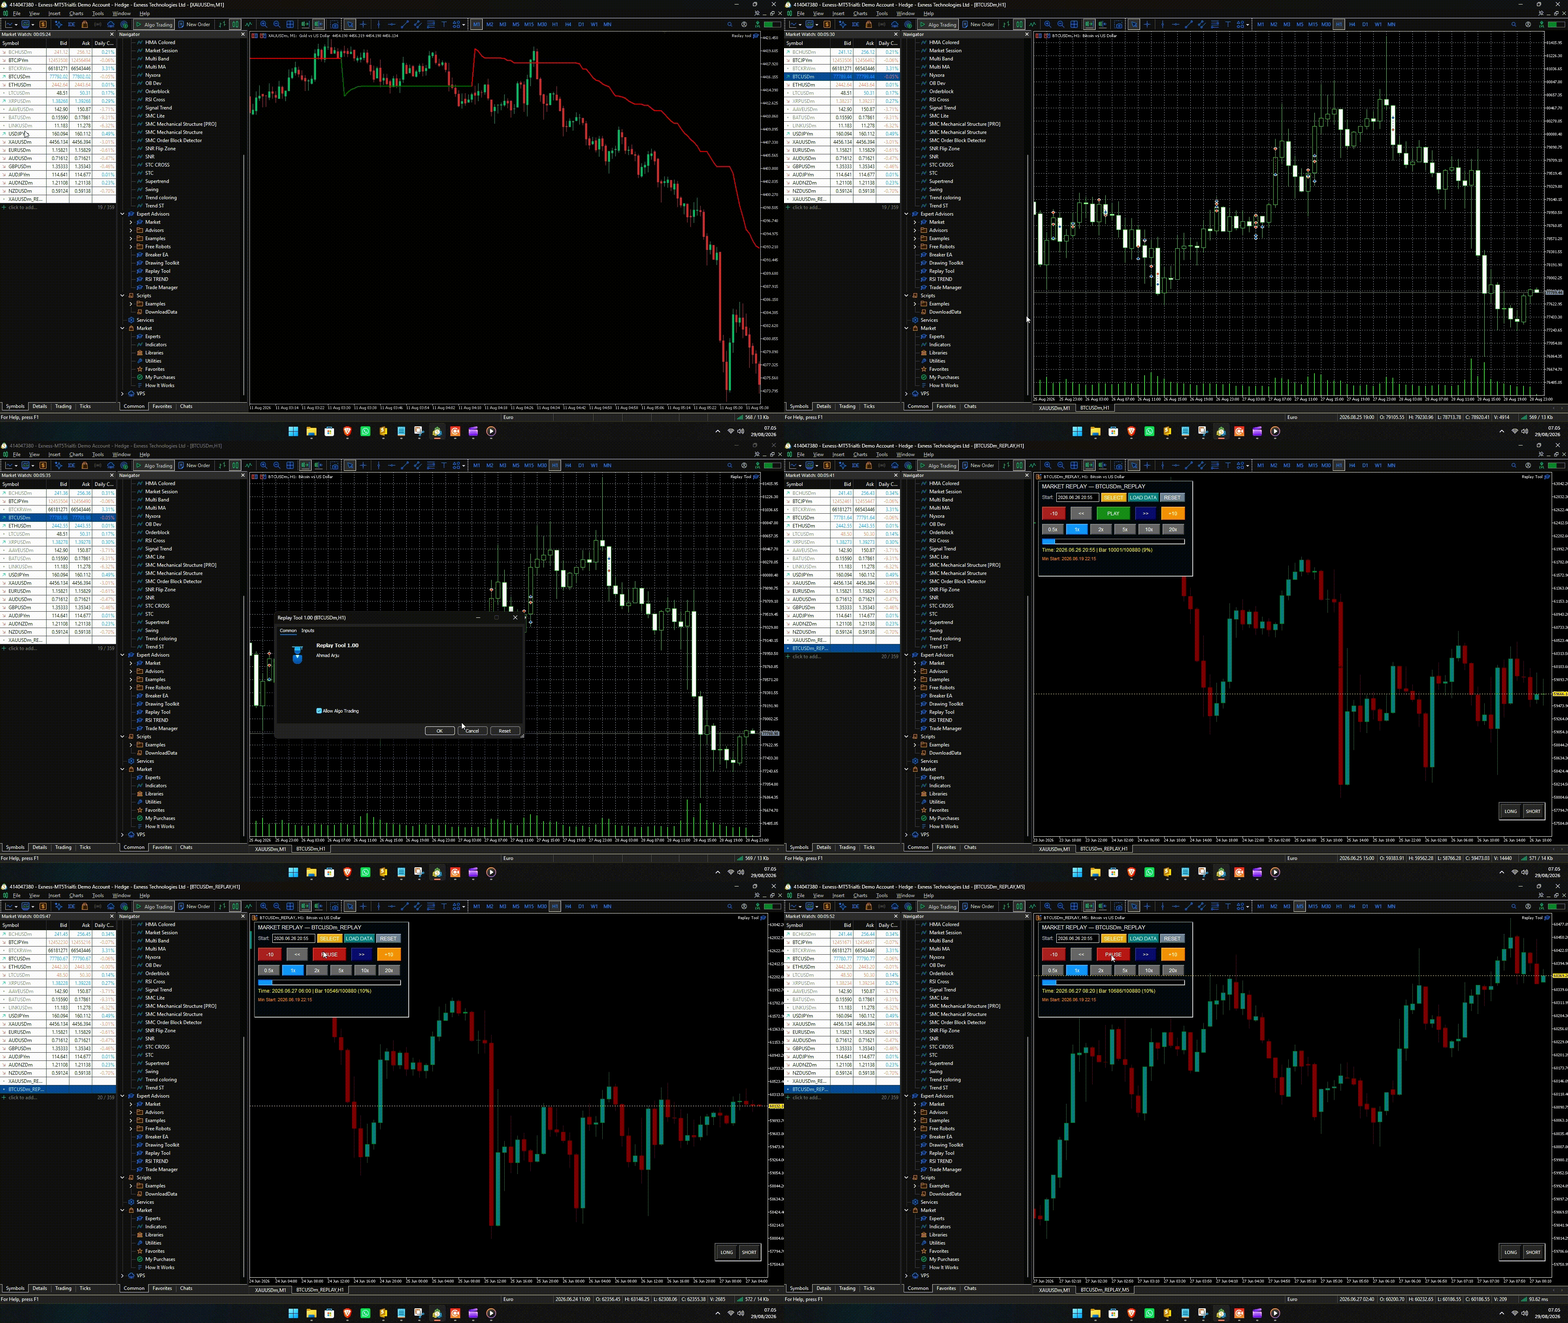
2. Starting the Replay On the Replay Panel (top-left), click "SELECT". A yellow vertical line will appear; drag it to your desired starting date. Once positioned, click "LOAD DATA", then click "PLAY" to start the simulation.
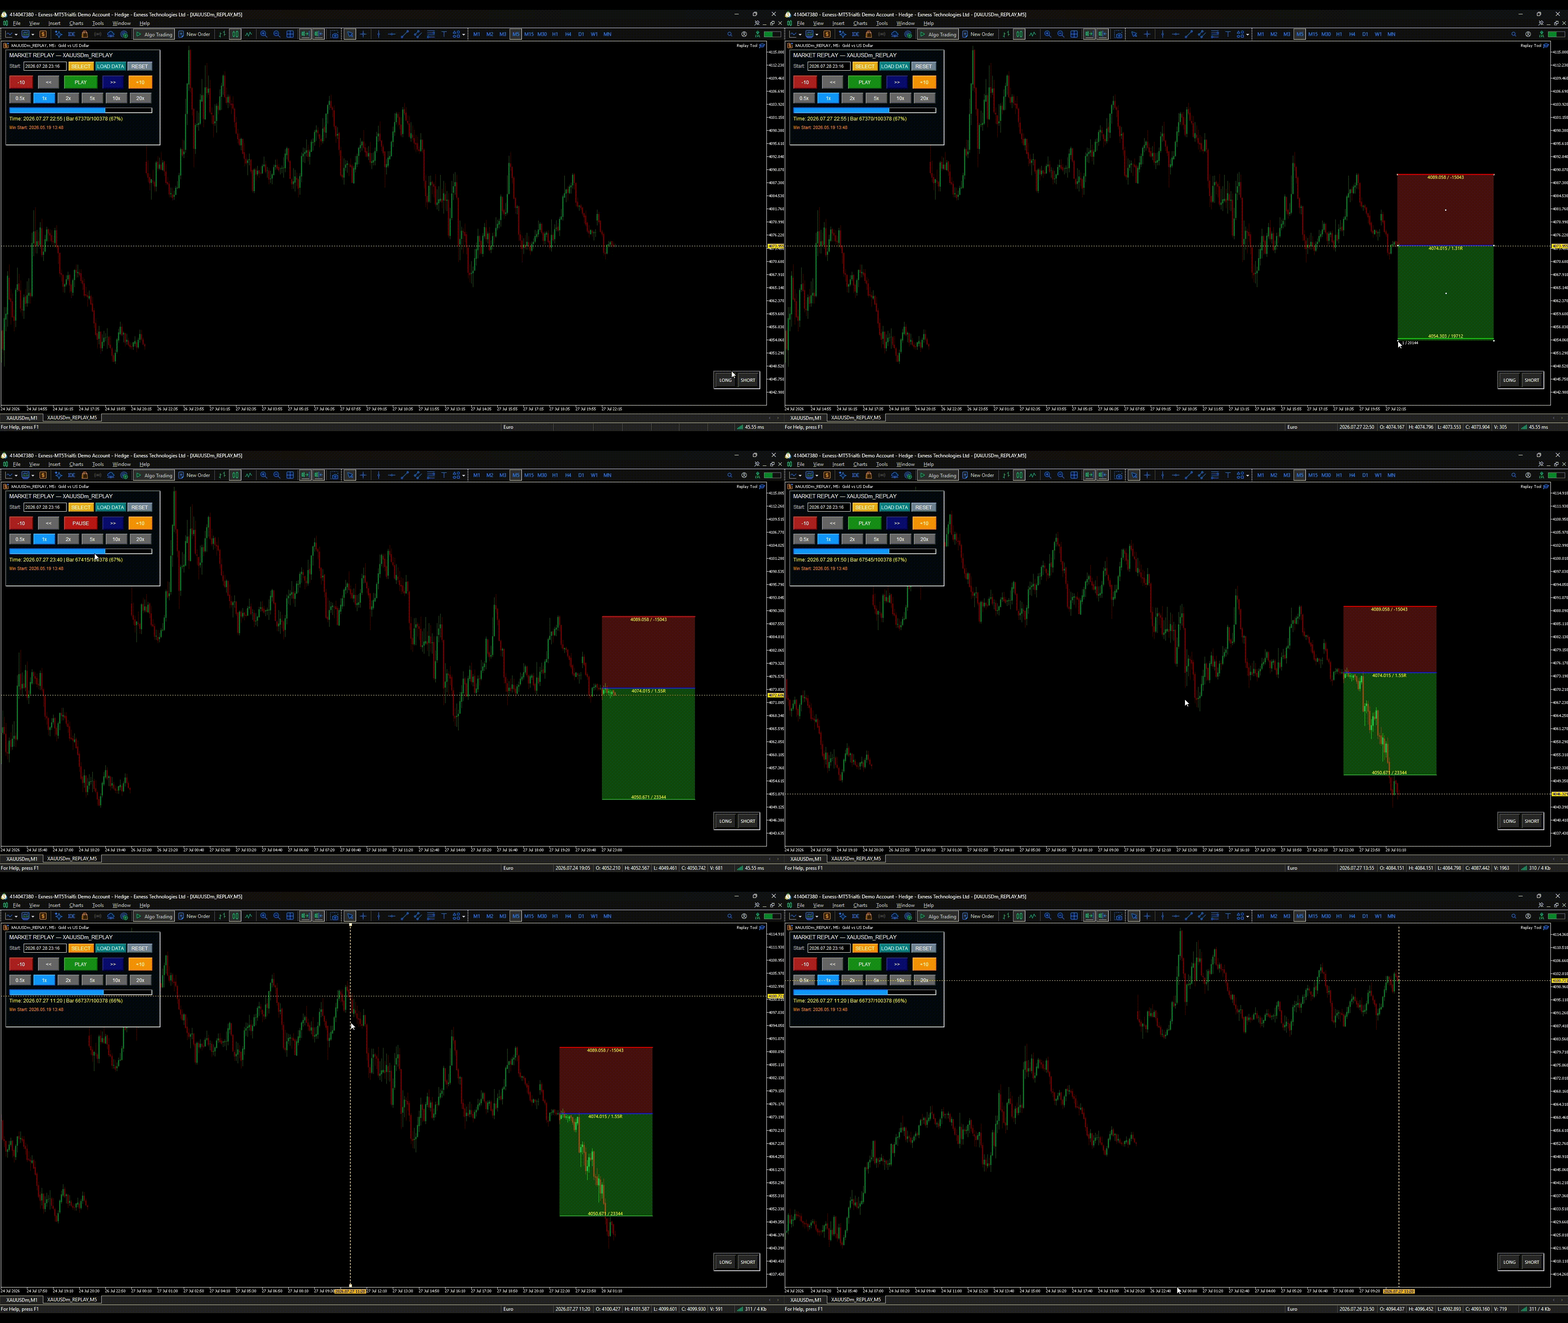
3. Playback Controls Use the speed multiplier buttons (0.5x to 20x) to adjust how fast the candles form. You can pause anytime or use the skip buttons ( +10 , -10 , << , >> ) to jump forward or backward quickly.
4. Drawing Trade Setups (Long/Short) Go to the Drawing Toolbar (bottom-right). Click "LONG" or "SHORT".
-
Click once on the chart to set your Entry price.
-
Move your mouse to determine the Stop Loss distance.
-
Click again to confirm and lock the setup (Take Profit is generated automatically).
-
Adjust dynamically: You can drag the Entry, Stop Loss, or Take Profit lines at any time to modify the setup.
⚠️ Important Note on Chart Settings:
To ensure the replay tool can load deep historical data without truncation, please verify your MetaTrader 5 chart settings. Navigate to Tools > Options > Charts from the top menu, and set "Max bars in chart" to Unlimited (or at least 1,000,000). If this limit is set too low, older historical data may not load correctly during the replay session.
 SpreadAudit – a broker’s actual spread based on M1 historical data
The script retrieves your broker’s actual spread from the ‘spread’ field of the M1 bars and displays the median, the 90th and 99th percentiles in price units, in pips and as a percentage of ATR, and also exports the average and maximum spreads for each hour of the day to a CSV file. This is needed to test strategies against the actual costs on your account, rather than against a ‘typical’ spread estimated from memory.
RepaintTest - measure whether a drawing indicator repaints
Measures whether a drawing indicator repaints, instead of asserting that it does not. The invariant: once a bar has closed and been processed, no object drawn on it may ever change - not move, not recolour, not change its text, and not disappear. The script seeds a custom symbol with real history, attaches your indicator through a template, records every object, appends bars, forces a full recalculation, and compares object by object. Changes and disappearances are counted separately, because only a change means the claim is false. A run that compared nothing is reported as INCONCLUSIVE, never as a pass. Output is a CSV you can publish next to the number.
 Adaptive_MACD
Adaptive MACD is a dynamic momentum indicator that adjusts its smoothing based on market conditions. It calculates a Pearson correlation coefficient between price and bar index over a user-defined period, then uses the resulting R² to blend two different MACD coefficient sets. This makes the MACD line more responsive during strong trends and smoother in sideways markets. The indicator plots a color-coded histogram (strong/weak bullish/bearish) and an optional auto-contrast MACD line that adapts to the chart background. Inputs allow customization of the R² period, fast/slow lengths, signal period, and colors. Suitable for trend-following and detecting momentum shifts.
SMC Entry Using structure
Market Structure & Smart Trade Tracker (MT5) An advanced all-in-one Smart Money Concepts (SMC) indicator that combines automated market structure mapping, momentum heatmap candles, and institutional trade execution tracking.