 MetaTrader 5
 Experts
 Indicators
 Scripts
 Libraries
 Storage
Join our fan page

RepaintTest - measure whether a drawing indicator repaints - script for MetaTrader 5

- Views:
- 655
- Rating:
- Published:
- Updated:
-
 You are missing trading opportunities:
- Free trading apps
- Over 8,000 signals for copying
- Economic news for exploring financial markets
Registration Log inYou agree to website policy and terms of use
If you do not have an account, please register -
 Need a robot or indicator based on this code? Order it on Freelance
Go to Freelance
Need a robot or indicator based on this code? Order it on Freelance
Go to Freelance
Almost every indicator description contains the phrase "non-repainting". Almost none contains a number. The phrase cannot be false, because there is no procedure attached to it - a developer who has never checked and a developer who has checked exhaustively write the same sentence. This script replaces the phrase with a measurement.
The invariant
Once a bar has closed and been processed, no object the indicator has drawn on it may ever change. Not move, not recolour, not change its text, and not disappear. That is a claim capable of being false, which is what makes it worth testing.
Method
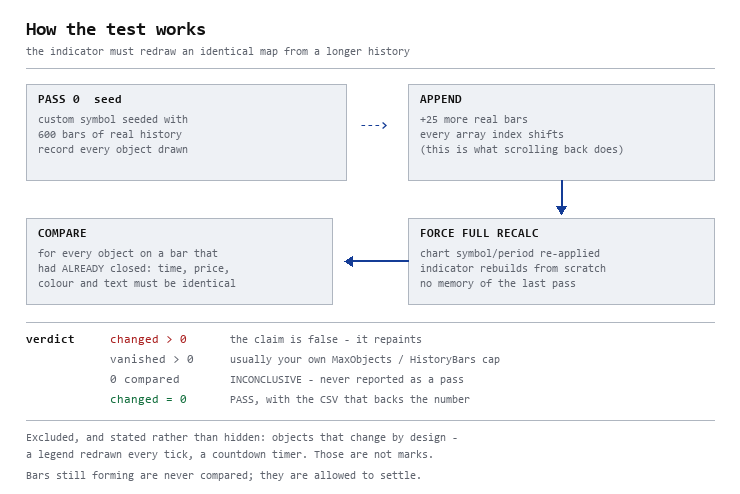
A custom symbol is seeded with a warm-up slice of real history, your indicator is attached through a template, and every object it draws is recorded. More bars are appended and the chart is forced through a full recalculation, so the indicator rebuilds every object from scratch over a longer history. Each object from the earlier pass that sits on an already-closed bar is then looked up in the new pass and compared field by field: both anchor times, both anchor prices, colour and text. Repeat for as many steps as you ask for.
A full rebuild is a harder test than an incremental tick. The indicator has to reproduce an identical map from a longer history, using different array indices, with no memory of what it drew last time. That is exactly what a user triggers by scrolling back far enough for the terminal to fetch older bars, and it is where object names keyed on the bar INDEX rather than the bar TIME come apart.
What it counts
Changes and disappearances are counted separately, and only a change means the claim is false. Most drawing indicators purge old objects on purpose once a cap is exceeded, so a disappearance is usually your own MaxObjects or HistoryBars setting rather than a defect. Run with those caps lifted.
A run that compared nothing is reported as INCONCLUSIVE, never as a pass. The most dangerous bug a test harness can have is reporting success on an empty run, since that is the number that ends up being quoted.
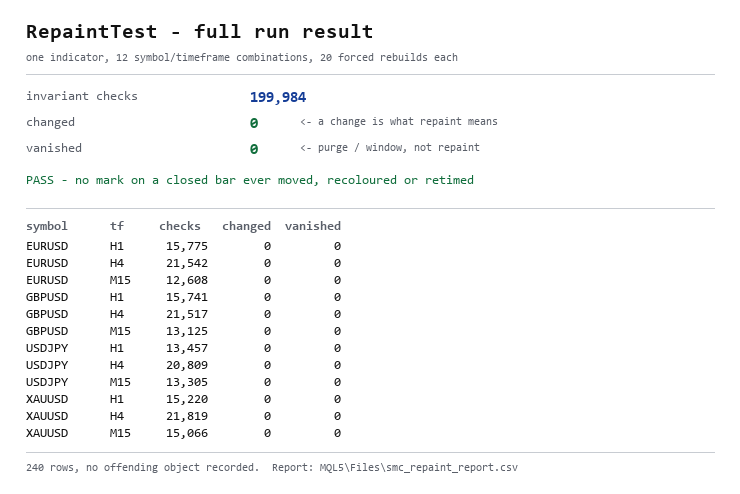
Output is a CSV in MQL5\Files, one row per symbol, timeframe and step, with the compared, changed and vanished counts and the first offending object. Sum the marks_compared column and you have the number you can publish - and the file that backs it up.
Usage
1. Set Prefix to your indicator's object name prefix. List in Exclude anything that changes by design: a legend redrawn every tick, a countdown timer. Those are not marks. Declaring them here is more honest than filtering them silently.
2. Attach your indicator to a chart with every drawing cap lifted, and save that chart as a template. Point Template at it.
3. Raise SettleMs until the mark count on the first pass stops changing between runs. Too short does not produce errors - it produces phantom disappearances.
4. Break something on purpose once: shift one object by a bar and confirm the script reports it, naming the field. A harness you have never seen fail is not yet evidence.
What it will not tell you
Whether the indicator is accurate, or whether its signals are any good. It answers one narrow question, which is the only reason the answer is worth anything.
Two tests that look like tests and are not, both tried and rejected before this one: the Strategy Tester, where an iCustom-driven indicator's objects are not enumerable by an EA on MT4 at all; and varying the indicator's own HistoryBars input on a live chart, which changes where the loop starts but leaves rates_total and every array index untouched, so the bug class this exists to catch is never exercised.
Free, and no attribution needed. If it finds something in your code, I would be glad to hear what.
 Support Resistance zig zag based
Support Resistance zig zag based is a Price Action indicator designed to automatically and dynamically map Support, Resistance, and transition areas (Flip Zones) on the chart. It focuses purely on clear price structure mapping and highlighting key bounce areas (SBR & RBS). It also includes an interactive dashboard to monitor real-time market bias.
Market Structure Entry Model
Market Structure Shift (CHoCH) Bullish Setup (CHoCH ): Price breaks above the previous confirmed Lower High (LH), signaling a trend reversal from bearish to bullish. Bearish Setup (CHoCH ): Price breaks below the previous confirmed Higher Low (HL), signaling a trend reversal from bullish to bearish.
SpreadAudit – a broker’s actual spread based on M1 historical data
The script retrieves your broker’s actual spread from the ‘spread’ field of the M1 bars and displays the median, the 90th and 99th percentiles in price units, in pips and as a percentage of ATR, and also exports the average and maximum spreads for each hour of the day to a CSV file. This is needed to test strategies against the actual costs on your account, rather than against a ‘typical’ spread estimated from memory.
 Market Replay Tool
Market Replay Tool is an MT5 utility that seamlessly merges a Market Replay simulator with interactive TradingView-style Long & Short drawing tools. It allows traders to backtest strategies on historical data with adjustable playback speeds, while effortlessly mapping out risk-to-reward setups using dynamic, draggable entry, stop-loss, and take-profit visual boxes directly on the chart.