 MetaTrader 5
 Experts
 Indicators
 Scripts
 Libraries
 Storage
Join our fan page

SpreadAudit – a broker’s actual spread based on M1 historical data - script for MetaTrader 5

- Views:
- 526
- Rating:
- Published:
- Updated:
-
 You are missing trading opportunities:
- Free trading apps
- Over 8,000 signals for copying
- Economic news for exploring financial markets
Registration Log inYou agree to website policy and terms of use
If you do not have an account, please register -
 Need a robot or indicator based on this code? Order it on Freelance
Go to Freelance
Need a robot or indicator based on this code? Order it on Freelance
Go to Freelance

Before getting too excited about the results of a backtest, it’s worth finding out how much you’re actually paying per trade. The trading terminal records the spread for each bar in the history, but this information is usually overlooked: the backtester displays the ‘current’ spread, whilst decisions are made based on a smooth equity curve.
What the script does
SpreadAudit scans the M1 historical data for the specified number of days, retrieves the spread field for each bar and calculates:
- the median, 90th and 99th percentiles of the spread – in price units and in pips;
- the same values as a proportion of ATR(H1), to compare instruments against one another;
- the average and maximum spread for each hour of the day – these are exported to a CSV file in the MQL5\Files folder.
Input parameters
- InpDays – the number of days of M1 historical data to analyse (1–3650, default 60);
- InpAtrPeriod – the ATR period on the H1 timeframe for normalisation (default 24);
- InpSaveCSV – whether to save the hourly table as a CSV file.
Output example
=== SpreadAudit: XAUUSD | actual range 30 May 2026 ... 29 July 2026 | 86,397 bars (0 excluding spread) === median bar spread: 0.37 (37.0 pts) p90 bar spread: 0.42 (42.0 pts) p99 bar spread: 0.45 (45.0 pts) H1 ATR(24) = 6.41 -> median spread = 0.058 ATR, p90 = 0.066 ATR
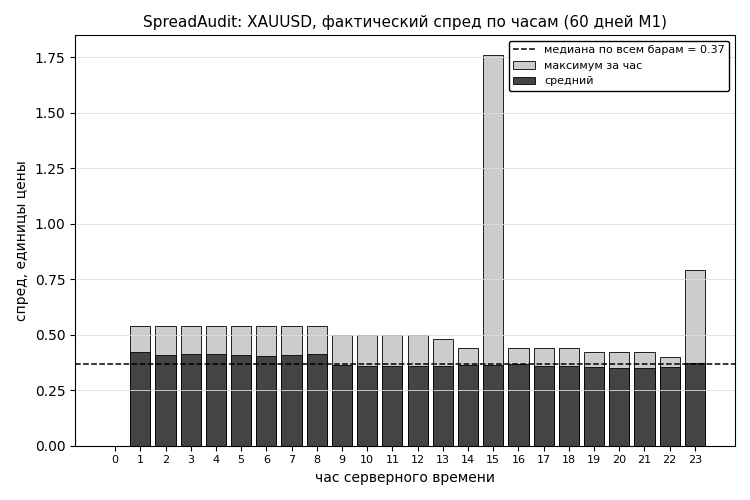
The attached chart shows the hourly price action for XAUUSD over 60 days. The average spread hovers around 0.40, but at the time of the daily rollover, the maximum jumps to almost 1.80 – that is, more than four times higher than usual. A strategy that operates specifically within this window does not pay the price it sees on average across the account.
Why is this important in practice?
A simple example. Let’s say your M5 pattern yields an average of 0.28 price units per trade – this is statistically significant and the effect is real. If the median spread for the instrument is 0.37, the system will run at a loss on a live account, even though it looks excellent on back-test data without transaction costs. The difference between ‘there is no effect’ and ‘there is an effect, but it is outweighed by the costs’ is fundamental: in the first case, the idea is discarded; in the second, you look for a timeframe or trade structure where the effect outweighs the spread.
The hourly chart shows at what times the spread widens. This usually occurs at rollover and in the first few minutes after the opening of trading sessions – if your strategy enters the market at precisely these times, it is worth setting a spread filter, and it is better to set it as a fraction of the ATR rather than in points: an absolute threshold becomes obsolete when volatility conditions change.
An important caveat
MetaTrader records the MINIMUM spread for that bar. This means that all the figures obtained represent an optimistic lower limit of what you actually pay. The logic is simple: if even the lower limit of costs is enough to ruin the strategy, there is nothing more to discuss.
If your broker’s ‘spread’ field in the M1 history is empty (some brokers show zeros there), the script will honestly report this and will not calculate statistics based on empty data.
Translated from Russian by MetaQuotes Ltd.
Original code: https://www.mql5.com/ru/code/75450
RepaintTest - measure whether a drawing indicator repaints
Measures whether a drawing indicator repaints, instead of asserting that it does not. The invariant: once a bar has closed and been processed, no object drawn on it may ever change - not move, not recolour, not change its text, and not disappear. The script seeds a custom symbol with real history, attaches your indicator through a template, records every object, appends bars, forces a full recalculation, and compares object by object. Changes and disappearances are counted separately, because only a change means the claim is false. A run that compared nothing is reported as INCONCLUSIVE, never as a pass. Output is a CSV you can publish next to the number.
 Support Resistance zig zag based
Support Resistance zig zag based is a Price Action indicator designed to automatically and dynamically map Support, Resistance, and transition areas (Flip Zones) on the chart. It focuses purely on clear price structure mapping and highlighting key bounce areas (SBR & RBS). It also includes an interactive dashboard to monitor real-time market bias.
 Market Replay Tool
Market Replay Tool is an MT5 utility that seamlessly merges a Market Replay simulator with interactive TradingView-style Long & Short drawing tools. It allows traders to backtest strategies on historical data with adjustable playback speeds, while effortlessly mapping out risk-to-reward setups using dynamic, draggable entry, stop-loss, and take-profit visual boxes directly on the chart.
Adaptive_MACD
Adaptive MACD is a dynamic momentum indicator that adjusts its smoothing based on market conditions. It calculates a Pearson correlation coefficient between price and bar index over a user-defined period, then uses the resulting R² to blend two different MACD coefficient sets. This makes the MACD line more responsive during strong trends and smoother in sideways markets. The indicator plots a color-coded histogram (strong/weak bullish/bearish) and an optional auto-contrast MACD line that adapts to the chart background. Inputs allow customization of the R² period, fast/slow lengths, signal period, and colors. Suitable for trend-following and detecting momentum shifts.