 MetaTrader 5
 Experts
 Indicators
 Scripts
 Libraries
 Storage
Join our fan page

Risk Lot Panel - indicator for MetaTrader 5

- Views:
- 44
- Published:
-
 You are missing trading opportunities:
- Free trading apps
- Over 8,000 signals for copying
- Economic news for exploring financial markets
Registration Log inYou agree to website policy and terms of use
If you do not have an account, please register -
 Need a robot or indicator based on this code? Order it on Freelance
Go to Freelance

A display-only panel that answers one question before you place a trade: what lot size does my risk allow here, and what does the broker's volume step do to it?
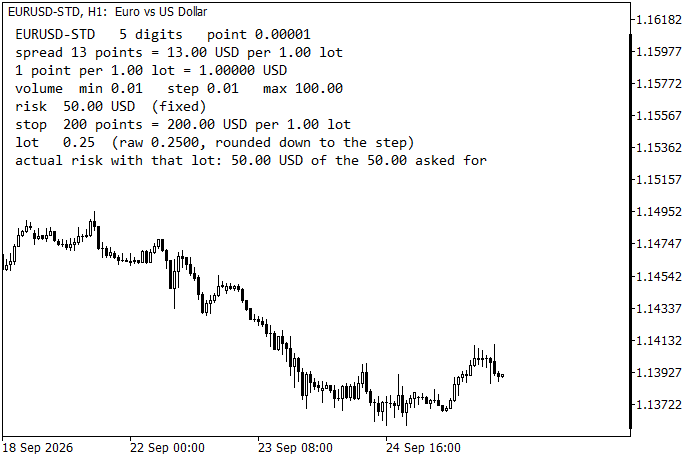
For the current symbol the panel shows:
- the spread in points, and what that spread costs per 1.00 lot;
- the money value of one point per 1.00 lot, taken from the broker's tick value and tick size, so the figure is right on gold, indices and cross-rate pairs, not only on EURUSD;
- the broker's volume constraints: minimum, step and maximum;
- your risk budget: percent of balance, percent of equity, or a fixed amount in the account currency;
- the loss per 1.00 lot at the stop distance you set;
- the resulting lot — the raw figure, then the lot after rounding DOWN to the volume step, and the money you actually risk with that rounded lot;
Two situations the panel is really written for:
1. The raw lot comes out below the broker minimum. Rounding up to the minimum silently breaks the risk cap, which is how a "1% risk" trade quietly becomes a 4% one on a small account. The panel says the risk cannot be respected and shows what the minimum lot would actually risk, in money and in percent of balance.
2. Rounding down to the volume step moves the real risk away from the number you asked for. The panel prints the actual risk next to the requested one, and highlights the line when the gap is larger than 10%.
The indicator never places, modifies or closes an order. It only reads symbol and account information and draws labels on the chart.
Inputs: risk mode (percent of balance / percent of equity / fixed money), risk value, stop distance in points, and the panel's corner, offsets, font and colours.
Tested on MetaTrader 5 build 6182, compiles with 0 errors and 0 warnings.
 BacktestOverfitting: probability of backtest overfitting (PBO) of an optimization
Probability of Backtest Overfitting (PBO) of an MT5 optimization by combinatorially symmetric cross-validation. Every pass sends its daily results as a frame, and the PBO is computed when the optimization ends.
DrawdownBootstrap: Monte Carlo of the maximal drawdown
Block bootstrap of daily results: how deep the drawdown of an account or strategy can get over the next months, with percentiles and a seeded generator for repeatable runs.
Accelerator Oscillator (AC)
The Acceleration/Deceleration Indicator (AC) measures acceleration and deceleration of the current driving force.
MACD Signals
Indicator edition for new platform.