 MetaTrader 5
 Experts
 Indicators
 Scripts
 Libraries
 Storage
Join our fan page

DrawdownBootstrap: Monte Carlo of the maximal drawdown - library for MetaTrader 5

What I do:
- Turn your strategy, TradingView script or written rules into a clean MT5 Expert Advisor
- Views:
- 57
- Published:
-
 You are missing trading opportunities:
- Free trading apps
- Over 8,000 signals for copying
- Economic news for exploring financial markets
Registration Log inYou agree to website policy and terms of use
If you do not have an account, please register -
 Need a robot or indicator based on this code? Order it on Freelance
Go to Freelance
DrawdownBootstrap.mqh estimates how deep the drawdown of an account or a strategy can get over the coming months, from its past daily results. The worst drawdown of a backtest happened once, in one order of events; a Monte Carlo of the same results in other orders shows the range to expect, and how often the worst of the history is exceeded.
Usage
#include <DrawdownBootstrap\DrawdownBootstrap.mqh>

double days[];                      // daily results in money (or in percent)
// ... fill the days ...
double dd[];
CDrawdownBootstrap::Run(days, 252, 10000, 10.0, 12345, dd);   // horizon, paths, mean block, seed
double p95 = CDrawdownBootstrap::Quantile(dd, 0.95);          // 1 period in 20 goes deeper than this
double worst = CDrawdownBootstrap::MaxDrawdown(days);         // the drawdown of the history itself
How it works
- Stationary bootstrap (Politis and Romano, 1994): a simulated path starts on a random day, continues with the following days, and jumps to a new random day with probability 1 / meanBlock. Whole stretches of days are kept together, so losing streaks and days when several positions lost at once stay in the simulation; drawing single days independently would make the drawdowns look smaller than they are.
- For each path the largest fall of the cumulated results from their peak is recorded. Quantile() gives any percentile of these drawdowns, with linear interpolation.
- CSeededRandom is a small mulberry32 generator: the same seed gives the same simulation on every computer, so a result can be checked again.
- Days are taken as they come: results in money assume fixed lots; for lots that grow with the balance, pass daily results in percent of the balance.
Example
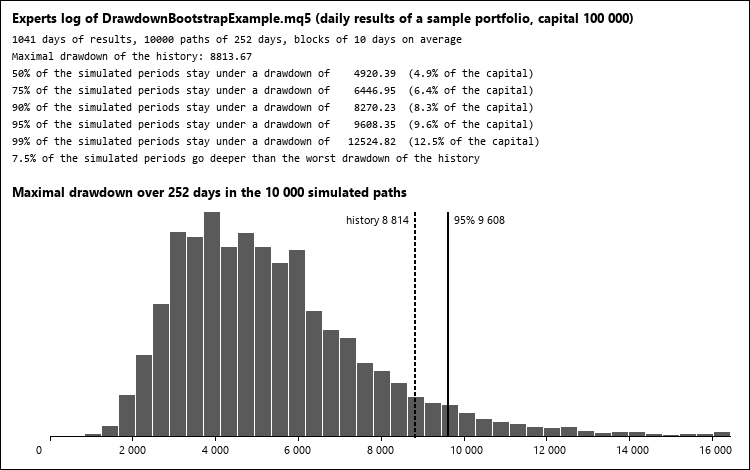
The script DrawdownBootstrapExample.mq5 takes the daily closed results of this account (all of them or one magic number), or a CSV file of daily results, simulates 10 000 paths of one year and prints the percentiles of the drawdown in money and as a percent of a capital, and the share of the paths that go deeper than the worst drawdown of the history (picture 1).
Checked
On 1 041 days of results, three runs (2 000 paths of 252 days with blocks of 10 days, 500 paths of 63 days with single days, 300 paths of 500 days with blocks of 25 days, three different seeds) gave the same drawdown for every path as an independent Python version of the same algorithm, within 2e-11.
Files
DrawdownBootstrap.mqh goes to MQL5\Include\DrawdownBootstrap, DrawdownBootstrapExample.mq5 to MQL5\Scripts\DrawdownBootstrap.
PortfolioWeights: risk parity, HRP, minimum variance and maximum diversification
Portfolio weights from the returns of symbols or Expert Advisors: inverse volatility, risk parity, hierarchical risk parity, minimum variance, maximum diversification, Ledoit-Wolf covariance.
TesterReport: read a saved Strategy Tester report into deals and trades
Reads a Strategy Tester report saved as HTML into its deals, closed trades, net profit and balance drawdowns, for comparing, combining or exporting backtests.
BacktestOverfitting: probability of backtest overfitting (PBO) of an optimization
Probability of Backtest Overfitting (PBO) of an MT5 optimization by combinatorially symmetric cross-validation. Every pass sends its daily results as a frame, and the PBO is computed when the optimization ends.
 MACD Signals
Indicator edition for new platform.