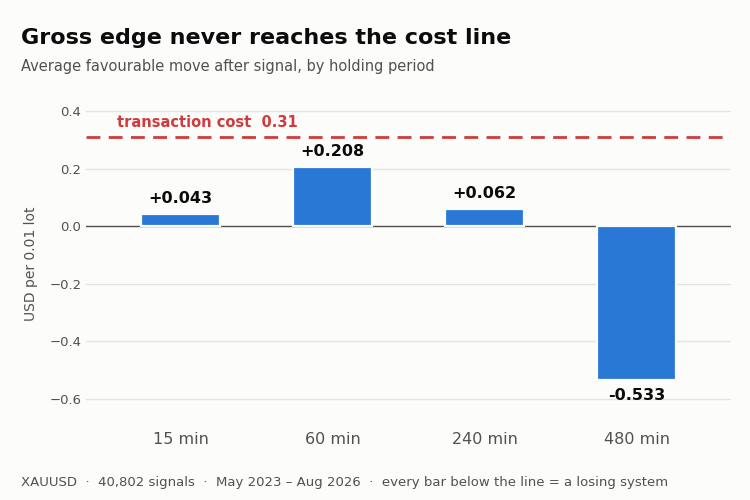
EdgeMeter answers one question about any entry signal:
after transaction costs, does this signal make money?
It places no orders. It reads history, evaluates your signal on every closed
bar, and prints a verdict.
WHY I WROTE IT
I spent a month building a grid EA on XAUUSD M1. I fixed the stop loss, added
a floating loss cap, a reversal exit, a maximum basket age. It kept losing.
When I finally measured the ENTRY signal on its own, the answer took thirty
seconds:
average move after signal, 15 min : +0.04
spread paid per round turn : 0.26
No exit logic can repair that. The money was lost at entry, and every hour I
spent on exits was wasted. That is what this script exists to prevent.
WHAT IT REPORTS
For each holding period you specify:
- gross edge: the average favourable move after the signal
- net result after cost, simulated one position at a time
- t-statistic computed on NON-OVERLAPPING trades
- share of profitable months
- maximum drawdown
Then it runs the same measurement on a RANDOM CONTROL: same firing rate,
coin-flip direction. A random entry must lose exactly the transaction cost,
no more and no less. This does two things. It proves the simulator is correct,
and it gives you the noise floor. If your signal does not clearly beat those
rows, it carries no information.
THE OVERLAP TRAP
This is the part that caught me, and it catches most people.
Consecutive signals share most of their forward window. A 60-bar horizon
sampled every bar gives you windows that overlap 59 ways. Treating them as
independent inflates the t-statistic by roughly the square root of the horizon.
My own signal showed t = 3.32 that way, which looks convincing. On genuinely
independent samples it was t = 1.20 - indistinguishable from noise. EdgeMeter
simulates one position at a time, so the trades it reports do not overlap and
the t-statistic is honest.
PASS CRITERIA
The script checks three, and all three are required:
[1] net per trade > 0 after cost
[2] |t| > 2
[3] at least 3 profitable months out of 4
Decide on your criteria before you look at the numbers. Deciding afterwards is
how a losing system gets promoted to a live account.
HOW TO TEST YOUR OWN SIGNAL
Open the file and edit two functions in the USER SECTION. Nothing else needs
to change.
bool UserInit() - create your indicator handles and load their
buffers with LoadBuffer() / LoadBufferB()
int UserSignal(int i) - evaluate closed bar i
return +1 to buy, -1 to sell, 0 to stand aside
All arrays are indexed 0 = oldest bar. This is the opposite of the usual
series indexing, and it is deliberate: a forward return is then simply
index + horizon, which removes a whole class of sign errors.
Entry is simulated at Open(i+1), the next bar. Never read bar i+1 or later
inside UserSignal - that is look-ahead bias, and it will make a worthless
signal look brilliant.
The default UserSignal is a two-timeframe moving average crossover, kept as a
worked example. Replace it.
SETTING THE COST
InpSpread, InpCommission and InpSlippage are in PRICE units, not points, and
they are the most important inputs in the script. Get them from your own
account, not from a broker's advertised figure.
If you have an execution log from live or demo trading, use the measured
average. If you do not, take the typical spread you see on the chart and add
a slippage allowance rather than assuming zero. A demo server will report
near-zero slippage; that is a property of the demo server, not of the market.
REQUIREMENTS
Load enough history before running: open a chart for your symbol and
timeframe and scroll far left. The script will tell you if there is not
enough. Fewer than 30 signals means any result is anecdote, not evidence.
Free to use and modify.
 MetaTrader 5
 Experts
 Indicators
 Scripts
 Libraries
 Storage


 You are missing trading opportunities:
 Need a robot or indicator based on this code? Order it on Freelance
Go to Freelance
Need a robot or indicator based on this code? Order it on Freelance
Go to Freelance

 Dynamic Session Range Sweep Detector with Liquidity Zone Marking
 AAPL cfd - ORB strategy