 MetaTrader 5
 Experts
 Indicators
 Scripts
 Libraries
 Storage
Join our fan page

Liquidity Void Decay Oscillator. - indicator for MetaTrader 5

- Views:
- 1544
- Rating:
- Published:
- Updated:
-
 You are missing trading opportunities:
- Free trading apps
- Over 8,000 signals for copying
- Economic news for exploring financial markets
Registration Log inYou agree to website policy and terms of use
If you do not have an account, please register -
 Need a robot or indicator based on this code? Order it on Freelance
Go to Freelance
Need a robot or indicator based on this code? Order it on Freelance
Go to Freelance
Liquidity Void Decay Oscillator
Short Description: Flags fast, thin-participation price displacements as "liquidity voids" and scores how quickly each one gets re-traded, turning that fill speed into a 0–100 exhaustion/continuation reading.
Author: ADEDAYO GBADEBO
The idea behind it
Most gap-based tools flag a void purely from candle geometry — three bars that don't overlap. That catches structure but misses the part that actually matters: whether the market that produced the gap had anyone in it. The Liquidity Void Decay Oscillator only registers a void when two conditions line up on the same bar — the bar's range has to blow past its recent average (a genuine displacement), and its tick volume has to fall below the recent average at the same time. That combination is the signature of a thin book: price moved a long way on comparatively few trades, which means very little resting interest actually traded through that price band.
Once a void is registered, it isn't treated as a fixed zone the way a static gap indicator would. It's given a starting "charge" of 100 and left to decay. Every time a later bar's range overlaps the void, the indicator measures what fraction of the zone got covered and removes a proportional chunk of the score. A zone that gets chewed through quickly is telling you the void was noise — the market simply came back and did the trading it skipped the first time. A zone that stays mostly charged after several passes is telling you something different: price keeps approaching that band and backing off, which is the classic footprint of a level still acting as a magnet or a wall. Run it on EURUSD, M15 or any liquid pair on a lower timeframe, since the volume-vs-range comparison needs enough bar-to-bar noise in participation to be meaningful — very illiquid or heavily gapped instruments will produce false voids.
How to interpret it
- Void Decay Score (histogram) — plots the strongest currently-active void's charge on a 0–100 scale. A fresh spike to the top means a new displacement void has just formed; a falling histogram means price is actively re-filling it.
- Color state — bars shade by which side the nearest active void sits on: one color when the strongest zone formed on an up-thrust (acting as potential support beneath price), a second color when it formed on a down-thrust (acting as potential resistance above price), and a neutral shade when no void is currently active.
- Signal Line — a short moving average of the decay score. When the histogram crosses below the signal line while still elevated, the fill is accelerating faster than its recent pace — a sign the void is being absorbed rather than defended.
- Practical usage — treat a score that stalls in the 60–100 range after two or three re-tests as a level worth trading off (mean-reversion toward it, rejection away from it). Treat a score that collapses toward zero on the first or second touch as confirmation to keep trading with the move that created the void, since the level offered no real resistance.
External variables (inputs)
| Input | Default | Purpose |
|---|---|---|
| InpLookback | 20 | Number of bars used to compute the rolling average range and average tick volume that a bar is compared against. |
| InpRangeMultiplier | 1.5 | A bar's range must exceed the average range multiplied by this factor to qualify as a displacement. |
| InpVolumeThreshold | 0.70 | A bar's tick volume must fall below the average volume multiplied by this factor to qualify as thin participation. |
| InpDecayRate | 15.0 | Score points removed for every 10% of a void zone that gets re-traded by a subsequent bar. |
| InpMaxVoids | 8 | Maximum number of unfilled void zones tracked at once; the weakest zone is replaced first once the limit is reached. |
| InpMinZonePoints | 0 | Minimum zone size in points required for a void to be registered; set above 0 to filter out very small displacements. |
| InpSignalSmoothing | 3 | Period of the simple moving average applied to the decay score to produce the signal line. |
Recommended use
Add the indicator to its own subwindow beneath price and keep the void zones visible on the chart itself by watching where the histogram spikes originate — that's the price band worth marking manually or with a rectangle tool. It pairs naturally with order-flow or session-timing tools: a void that forms right at a session open or overlap and then fails to decay through the next session carries more weight than one formed mid-session with no follow-through. Avoid trading the very first spike in isolation — wait for at least one re-test so the decay behavior actually has something to measure. On trending instruments, voids that sit against the trend and decay fast make reasonable continuation confirmation, while voids that sit in the direction of the trend and refuse to decay are the more interesting mean-reversion candidates.
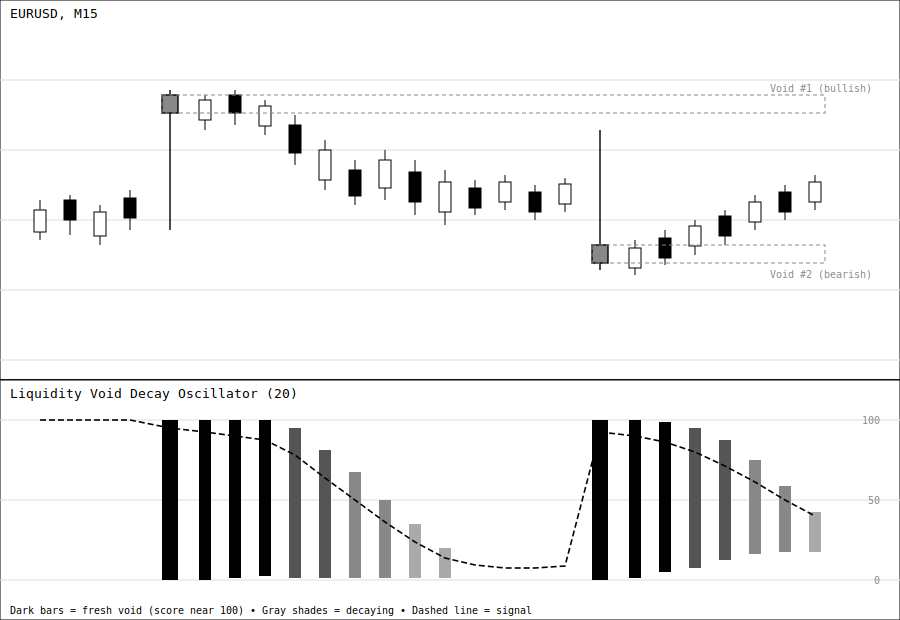
Fig. 1. EURUSD M15 with two displacement voids marked by dashed gray rectangles on the price panel; the subwindow histogram shows each void's decay score starting near 100 and fading through gray shades as price re-trades the zone, with the dashed signal line tracking the smoothed decline.
 Server Clock and Daily Reset Hour
A free, read-only MetaTrader 5 panel that converts your prop firm's daily reset rule (written in whatever time zone the firm uses) into your broker's actual server time, shows a live countdown to the next reset, and warns you before a daylight-saving shift moves the boundary by an hour. Sends no orders, reads no account data, display only.
Currency Strength Meter
Ranks the 8 major currencies by relative strength on a live on-chart panel, calculated from the average percentage change of every available cross pair — not just USD pairs — so weak/strong currencies are visible at a glance, independent of whichever chart you have open.
Dynamic Session Range Sweep Detector with Liquidity Zone Marking
Tracks the Asian, London, and New York session ranges, locks each one at session close, and flags true liquidity sweeps — a wick that pierces a locked high or low and closes back inside it — with an arrow signal and a shaded reaction zone. Non-repainting, works on any symbol and timeframe.
 EdgeMeter - does your entry signal beat the spread?
Measures whether an entry signal actually beats transaction costs, before you spend weeks building an EA around it. Reports net result after cost, an honest t-statistic on non-overlapping samples, and a random control. Places no orders.