 MetaTrader 5
 Experts
 Indicators
 Scripts
 Libraries
 Storage
Join our fan page

Multi-Symbol Correlation Divergence Meter - indicator for MetaTrader 5

- Views:
- 1159
- Rating:
- Published:
- Updated:
-
 You are missing trading opportunities:
- Free trading apps
- Over 8,000 signals for copying
- Economic news for exploring financial markets
Registration Log inYou agree to website policy and terms of use
If you do not have an account, please register -
 Need a robot or indicator based on this code? Order it on Freelance
Go to Freelance
Need a robot or indicator based on this code? Order it on Freelance
Go to Freelance
Multi-Symbol Correlation Divergence Meter
Author: Adeolu Gbadebo
The idea behind it
Most pairs and instruments spend long stretches moving together. EURUSD tracks GBPUSD, gold tracks silver, an index tracks its heaviest-weighted stock. That relationship is what a lot of hedging, basket, and pairs-trading logic quietly depends on — and it isn't constant. It compresses during calm sessions and breaks apart around news, liquidity gaps, or a divergence in the two instruments' underlying drivers. This indicator puts a number on that relationship instead of leaving it to eyeballing two charts side by side.
It computes a rolling Pearson correlation between the bar-to-bar returns of the current symbol and a reference symbol you specify in the inputs, over a configurable lookback. Alongside that, it tracks the log-price spread between the two instruments — essentially how far the current symbol has drifted from the reference on a relative basis — and converts that spread into a rolling z-score. A "divergence break" is flagged only when both conditions line up: the correlation has dropped below your decoupling threshold and the spread z-score has pushed past an extreme reading, which is the combination that tends to precede either a reversion snap-back or the start of a genuinely new regime between the two instruments.
Run it on any symbol with a liquid, correlated counterpart — EURUSD against GBPUSD, a metals pair against DXY, or two correlated index CFDs. It's built as a separate-window indicator, so it plots underneath price rather than over it, keeping the chart itself uncluttered.
How to interpret it
- Correlation line — the rolling Pearson correlation between the two symbols' returns, bounded between -1 and +1. It renders in a light gray while the pair stays "coupled" (above the breakdown threshold) and switches to white the moment correlation falls below it, so a decoupling phase is visible at a glance without reading the exact value.
- Spread Z-Score histogram — a rolling z-score of the log-price spread between the current symbol and the reference symbol. Readings near zero mean the spread sits close to its recent average; readings pushing toward ±2 or beyond mean the current symbol has stretched unusually far from the reference on a relative basis.
- Divergence Up / Divergence Down arrows — plotted only when correlation is decoupled and the z-score is extreme at the same time. An up arrow marks a negative spread extreme (the current symbol has lagged the reference and may be due to catch up); a down arrow marks a positive spread extreme (the current symbol has run ahead and may be due to give some of that back).
- Practical usage — treat sustained high correlation as a green light for relative-value or hedged setups that assume the two instruments keep moving together. Treat a divergence arrow as a cue to either tighten risk on positions that assume correlation, or look for a short-term mean-reversion trade in the direction the arrow implies, ideally with a price-action or momentum confirmation on the current symbol's own chart.
External variables (inputs)
| Input | Default | Purpose |
|---|---|---|
| InpRefSymbol | "GBPUSD" | Reference symbol the current chart's returns and spread are compared against. Must be available in Market Watch. |
| InpCorrPeriod | 50 | Number of bars used to compute the rolling Pearson correlation of returns between the two symbols. |
| InpZPeriod | 50 | Number of bars used to compute the mean and standard deviation of the log-price spread for the z-score. |
| InpCorrLowThreshold | 0.30 | Absolute correlation level below which the two symbols are treated as "decoupled" and the line turns white. |
| InpZScoreThreshold | 2.0 | Absolute spread z-score required, together with decoupled correlation, to plot a divergence arrow. |
| InpArrowsEnabled | true | Toggles the Divergence Up / Divergence Down arrow markers on or off. |
| InpNormalColor | clrSilver | Correlation line color while the pair remains coupled (above the breakdown threshold). |
| InpBreakdownColor | clrWhite | Correlation line color once the pair decouples (below the breakdown threshold). |
| InpZScoreColor | clrGray | Histogram color for the spread z-score plot. |
Recommended use
Add the indicator to the symbol you actually intend to trade, and set InpRefSymbol to whichever instrument it normally tracks — a correlated FX pair, a related commodity, or a benchmark index. Start with the default 50-bar lookbacks on M15 or H1; shorter periods react faster but produce noisier correlation swings, longer periods are steadier but slower to flag a genuine break. Combine a divergence arrow with your own structure or momentum read on the current symbol before acting on it — the indicator identifies when two instruments have come apart statistically, not which one is "right," so a confirming signal on price keeps you from fading a break that turns out to be the start of a new trend rather than a snap-back.
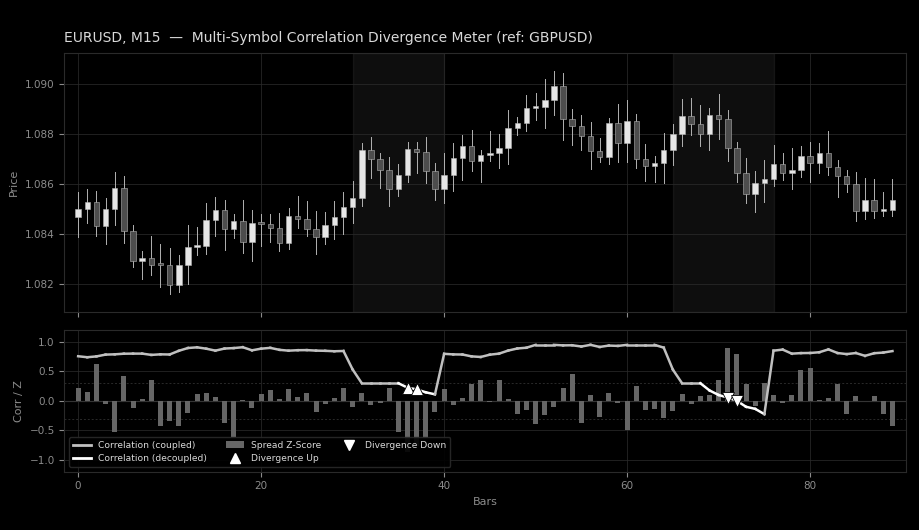
Fig. 1. EURUSD M15 with the Multi-Symbol Correlation Divergence Meter plotted against GBPUSD. The correlation line switches from silver to white as the pair decouples, the gray histogram shows the spread z-score stretching to an extreme, and the white arrows mark the resulting divergence break events.
Adaptive Volume Profile Node Tracker
Builds a rolling, volatility-adaptive volume profile over a configurable lookback window and plots the Point of Control (POC), Value Area High/Low, and statistically significant High/Low Volume Nodes (HVN/LVN) directly on the chart.
Volume-Weighted Delta Divergence Oscillator
A normalized order-flow oscillator that estimates buy/sell volume pressure per bar, accumulates it into a rolling delta, and automatically flags regular bullish and bearish divergence against price swings.
Candle Body-to-Wick Pressure Oscillator
Converts the body-to-wick makeup of every candle into a bounded conviction reading, then smooths it into an oscillator that flags buyer/seller pressure and automatically marks divergence against price.
Currency Strength Meter
Ranks the 8 major currencies by relative strength on a live on-chart panel, calculated from the average percentage change of every available cross pair — not just USD pairs — so weak/strong currencies are visible at a glance, independent of whichever chart you have open.