 MetaTrader 5
 Experts
 Indicators
 Scripts
 Libraries
 Storage
Join our fan page

Volume-Weighted Delta Divergence Oscillator - indicator for MetaTrader 5

Gmail: Adeolugbadebo500@gmail.com
- Views:
- 1382
- Rating:
- Published:
- Updated:
-
 You are missing trading opportunities:
- Free trading apps
- Over 8,000 signals for copying
- Economic news for exploring financial markets
Registration Log inYou agree to website policy and terms of use
If you do not have an account, please register -
 Need a robot or indicator based on this code? Order it on Freelance
Go to Freelance
Need a robot or indicator based on this code? Order it on Freelance
Go to Freelance
Volume-Weighted Delta Divergence Oscillator
Author: Adeolu Gbadebo
The idea behind it
Most retail platforms don't expose real order-flow data, but a bar's own shape already tells you where volume was concentrated. If a candle closes near its high, buying pressure likely dominated that bar; if it closes near its low, selling pressure did. The indicator turns this into a per-bar delta proxy: it takes the position of the close within the bar's high-low range, converts that into a ratio between -1 and +1, and multiplies it by that bar's volume (tick volume or real volume, selectable). Bars with a wide range and a close near the extreme, on strong volume, produce a large delta reading in either direction.
Those per-bar deltas are then summed over a rolling window (InpDeltaPeriod) to build a cumulative delta line, and that line is normalized by its own recent standard deviation (InpNormPeriod) so the oscillator reads on a comparable scale across symbols and volatility regimes, rather than as a raw, unbounded volume figure. A short moving average (InpSmoothPeriod) removes bar-to-bar noise before the value is plotted. On top of that oscillator, the indicator scans for confirmed swing highs and lows in price (using a symmetric fractal-style window, InpDivLookback bars on each side) and compares each new swing against the most recent prior swing of the same type. If price prints a higher high while the oscillator prints a lower high, that's regular bearish divergence — buying pressure is fading even as price pushes higher. The mirror case, a lower low in price against a higher low in the oscillator, is regular bullish divergence. Best used on EURUSD, GBPUSD, and other liquid pairs on the M15 to H4 charts, where tick volume is a reasonably dense proxy for real trading activity.
How to interpret it
- VWDD Oscillator histogram — the main two-tone histogram in the subwindow. Bars above the zero line (lighter shade) indicate net buying pressure has dominated recently; bars below zero (darker shade) indicate net selling pressure. The further from zero, the more one-sided the recent order flow has been relative to its own history.
- Normalization method — the raw cumulative delta is divided by its rolling standard deviation, producing a z-score-like reading. This keeps the oscillator's scale stable across instruments and sessions instead of drifting with average volume levels.
- Divergence arrows — an upward arrow beneath the histogram marks a confirmed bullish divergence (price low undercut, oscillator low did not); a downward arrow above the histogram marks a confirmed bearish divergence (price high exceeded, oscillator high did not). Because swing confirmation needs bars on both sides, arrows appear with a lag of roughly InpDivLookback bars after the actual swing bar — this is a trade-off for reliability, not a bug.
- Practical usage — treat divergence arrows as an early warning to tighten stops or start scaling out of a position in the direction of the existing trend, not as a standalone reversal entry signal. Combine with a structure break, a trendline violation, or a lower-timeframe confirmation candle before entering counter-trend. Sustained histogram readings on one side of zero, without divergence, can also be used as trend-continuation confirmation.
External variables (inputs)
| Input | Default | Purpose |
|---|---|---|
| InpDeltaPeriod | 20 | Number of bars summed into the rolling cumulative volume delta. |
| InpNormPeriod | 50 | Lookback used to compute the standard deviation that normalizes the cumulative delta into a z-score-style reading. |
| InpSmoothPeriod | 5 | Simple-average smoothing period applied to the normalized oscillator before it is plotted. |
| InpVolumeType | Tick volume | Selects tick volume or real volume (where the feed provides it) as the weighting factor for the per-bar delta. |
| InpDivLookback | 10 | Bars required on each side of a candidate bar to confirm it as a swing high or swing low. |
| InpDivSearchRange | 100 | Maximum number of bars searched backward for a prior swing point when checking for divergence. |
| InpShowArrows | true | Enables or disables plotting of the bullish/bearish divergence arrows. |
| InpArrowOffset | 0.30 | Vertical distance, in oscillator units, between a divergence arrow and the histogram it marks. |
Recommended use
Load the indicator in its own subwindow beneath the price chart. Start with the default settings on M15–H1 charts of major FX pairs, where volume is reasonably continuous; on thinly traded symbols, consider lengthening InpNormPeriod so the normalization isn't skewed by a handful of unusually quiet bars. When a divergence arrow appears, check the higher timeframe trend first — divergence against the dominant trend is best treated as a caution flag rather than an automatic reversal trade. Pairing the oscillator with a simple structure or support/resistance template keeps false signals from choppy, low-volume periods to a minimum.
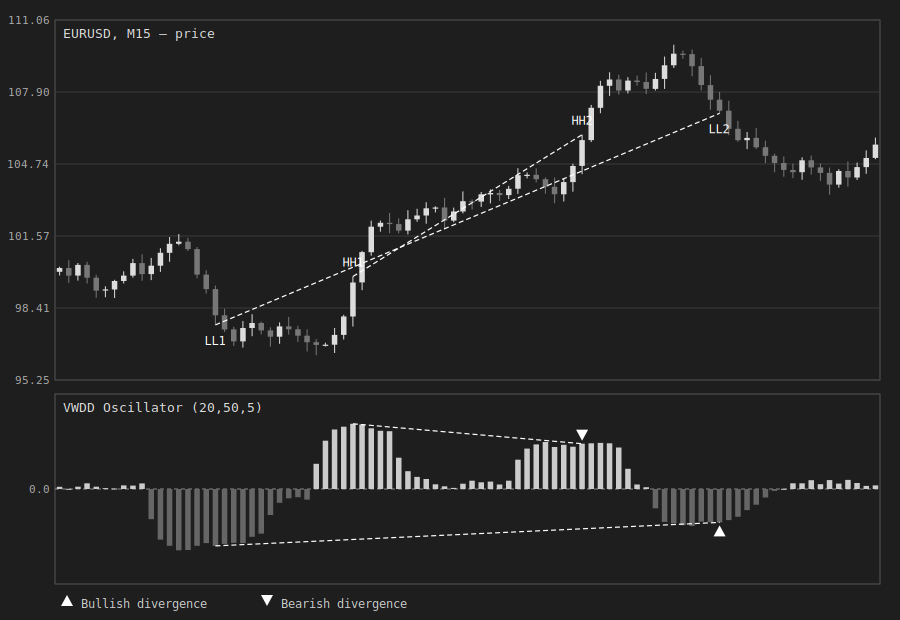
Fig. 1. VWDD Oscillator in its subwindow beneath price. The two-tone histogram shows accumulated, normalized buy/sell pressure; dashed lines connect the compared swing pairs, with a downward arrow flagging bearish divergence at the second price high and an upward arrow flagging bullish divergence at the second price low.
Volume-Weighted Price Displacemet Oscillator
Plots a volume-weighted, volatility-normalized oscillator that flags impulse and exhaustion conditions as price stretches away from its rolling VWAP
BMP Chart Wallpaper
BMP Chart Wallpaper Background for MT5
Adaptive Volume Profile Node Tracker
Builds a rolling, volatility-adaptive volume profile over a configurable lookback window and plots the Point of Control (POC), Value Area High/Low, and statistically significant High/Low Volume Nodes (HVN/LVN) directly on the chart.
Multi-Symbol Correlation Divergence Meter
Tracks the rolling correlation between the current chart symbol and a chosen reference symbol, and flags the moment they decouple while their price spread is statistically stretched.