 MetaTrader 5
 Experts
 Indicators
 Scripts
 Libraries
 Storage
Join our fan page

Volume-Weighted Price Displacemet Oscillator - indicator for MetaTrader 5

- Views:
- 1614
- Rating:
- Published:
- Updated:
-
 You are missing trading opportunities:
- Free trading apps
- Over 8,000 signals for copying
- Economic news for exploring financial markets
Registration Log inYou agree to website policy and terms of use
If you do not have an account, please register -
 Need a robot or indicator based on this code? Order it on Freelance
Go to Freelance
Need a robot or indicator based on this code? Order it on Freelance
Go to Freelance
Author: Sanmi Samuel Ojo
The idea behind it
Most mean-reversion tools measure price against a simple moving average, which treats every bar as equally important regardless of how much trading actually happened on it. The Volume-Weighted Price Displacement Oscillator takes a different anchor: a rolling volume-weighted average price (VWAP) calculated over a configurable lookback window. Bars with heavier volume pull the anchor toward them more strongly than quiet bars, so the reference line reflects where the market has actually been transacting, not just where price happened to close.
The core calculation is a displacement: current close minus the rolling VWAP. On its own that number is meaningless across instruments and timeframes, so it is normalized by the rolling standard deviation of closing prices over a second, independently configurable period. The result behaves like a rolling z-score: values near zero mean price is trading close to its volume-weighted center, while readings beyond ±1.0 signal an impulse move gaining distance from fair value, and readings beyond ±2.0 flag statistical exhaustion — a stretch large enough that a reversion or consolidation becomes statistically more likely. This works well on any liquid symbol; it was built and tested primarily on EURUSD and other major FX pairs on the M15 and H1 charts, though the underlying math is timeframe-agnostic.
How to interpret it
- VW Displacement histogram — the main oscillator, plotted as a color-coded histogram in a subwindow. Its height is the normalized distance between price and the rolling VWAP; the five shades map directly to the state of the move (bullish exhaustion, bullish impulse, neutral, bearish impulse, bearish exhaustion).
- Rolling VWAP normalization — instead of a fixed standard deviation, the indicator recalculates volatility on every bar over the InpVolatilityPeriod window, so the thresholds adapt automatically as the instrument moves between quiet and volatile regimes rather than staying fixed in raw price terms.
- Signal states — neutral (between -1.0 and +1.0) means price is orbiting fair value; impulse (beyond ±1.0) means a genuine directional push is underway; exhaustion (beyond ±2.0) means the move has stretched further than its recent volatility typically supports, a zone traders often watch for stalling momentum or a snapback.
- Practical usage — in trending conditions, impulse readings that hold without reaching exhaustion can be used to confirm continuation entries in the direction of the move. In range-bound conditions, exhaustion readings that coincide with the dashed signal line turning back toward zero are often used as mean-reversion entry cues, ideally combined with a structural level or secondary confirmation rather than traded in isolation.
External variables (inputs)
| Input | Default | Purpose |
|---|---|---|
| InpVWAPPeriod | 20 | Number of bars used to compute the rolling volume-weighted average price that serves as the fair-value anchor. |
| InpVolatilityPeriod | 14 | Number of bars used to compute the rolling standard deviation of closing prices, which normalizes the raw displacement into a z-score. |
| InpSignalPeriod | 5 | Smoothing period (simple moving average) applied to the oscillator to produce the dashed signal line. |
| InpImpulseLevel | 1.0 | Z-score threshold above which a move is classified as an impulse (directional push) rather than noise. |
| InpExhaustionLevel | 2.0 | Z-score threshold above which a move is classified as statistically exhausted and prone to reversion or consolidation. |
| InpVWAPPrice | PRICE_TYPICAL | Applied price used when weighting each bar into the rolling VWAP calculation. |
Recommended use
Attach the indicator to a subwindow beneath price and keep the default 20/14/5 settings as a starting point on M15–H1 charts; shorten the periods for scalping timeframes and lengthen them on H4/D1 for swing analysis. It pairs naturally with a plain VWAP or moving average on the price chart itself, since the oscillator's zero line corresponds to that same rolling fair-value anchor. Because the thresholds are volatility-adjusted z-scores rather than fixed price distances, the indicator can be left on the same settings across different instruments and timeframes without manual recalibration. For discretionary trading, treat exhaustion readings as a prompt to tighten risk or look for reversal confirmation rather than an automatic reversal signal on their own.
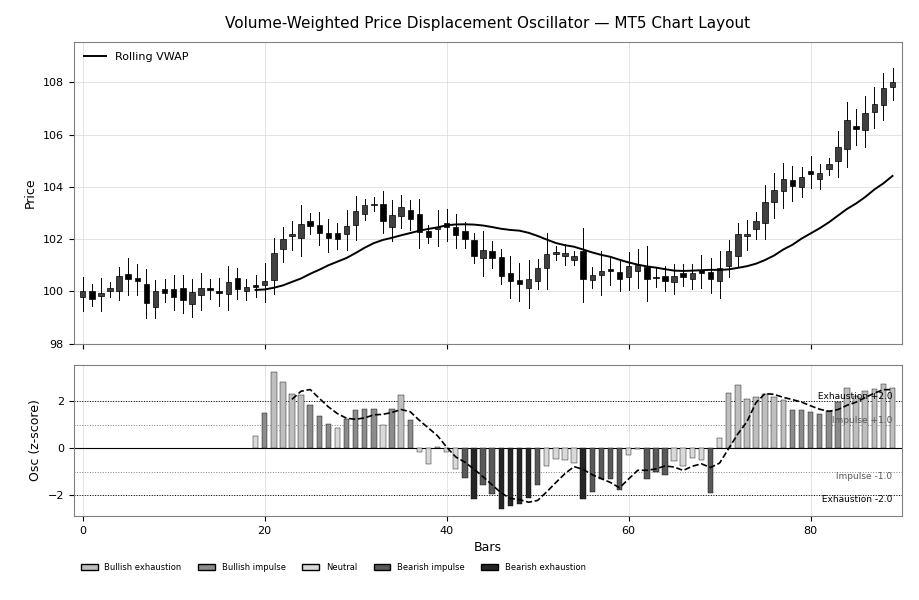
Fig. 1. MT5-style layout: candlesticks with the rolling VWAP anchor on the price chart, and the color-coded displacement oscillator with dashed signal line and ±1.0 / ±2.0 threshold levels in the subwindow below.
BMP Chart Wallpaper
BMP Chart Wallpaper Background for MT5
 Broker Spec Inspector
Prints the invisible contract limits that silently reject orders: stops level, freeze level, min/step/max lot, tick size and value, spread type, execution mode, swaps, and the margin needed for the minimum lot against your free margin.
Volume-Weighted Delta Divergence Oscillator
A normalized order-flow oscillator that estimates buy/sell volume pressure per bar, accumulates it into a rolling delta, and automatically flags regular bullish and bearish divergence against price swings.
Adaptive Volume Profile Node Tracker
Builds a rolling, volatility-adaptive volume profile over a configurable lookback window and plots the Point of Control (POC), Value Area High/Low, and statistically significant High/Low Volume Nodes (HVN/LVN) directly on the chart.