 MetaTrader 5
 Experts
 Indicators
 Scripts
 Libraries
 Storage
Join our fan page
- Published by:
-
Amanda Vitoria De Paula Pereira
 I am a Software Engineer focused on quantitative architecture and high-frequency trade execution, I do not build generic retail scripts, I write clean code designed to survive live broker environments, toxic order flow, and server latency, my infrastructure handles complex math without freezing the
 - Views:
- 1841
- Rating:
- Published:
- Updated:
-
 You are missing trading opportunities:
- Free trading apps
- Over 8,000 signals for copying
- Economic news for exploring financial markets
Registration Log inYou agree to website policy and terms of use
If you do not have an account, please register -
 Need a robot or indicator based on this code? Order it on Freelance
Go to Freelance
Need a robot or indicator based on this code? Order it on Freelance
Go to Freelance
Why I Built This DSP Engine
Standard oscillators like RSI, Stochastic, or CCI always bothered me during strong trend expansions. When institutional volume enters the market, these indicators get pinned at their extreme boundaries (sitting at 90 or 10 for hours). They lose all dynamic sensitivity, triggering premature reversal signals that trap retail traders against powerful order flow.
The core issue is statistical: standard technical indicators assume market prices naturally follow a normal bell curve. They don't. Price action is non-linear and chaotic.
To fix this boundary-flattening problem, I implemented Digital Signal Processing (DSP) mathematics—specifically John F. Ehlers' Fisher Transform—to normalize price data directly inside MetaTrader 4.
The Mathematics: PDF Normalization
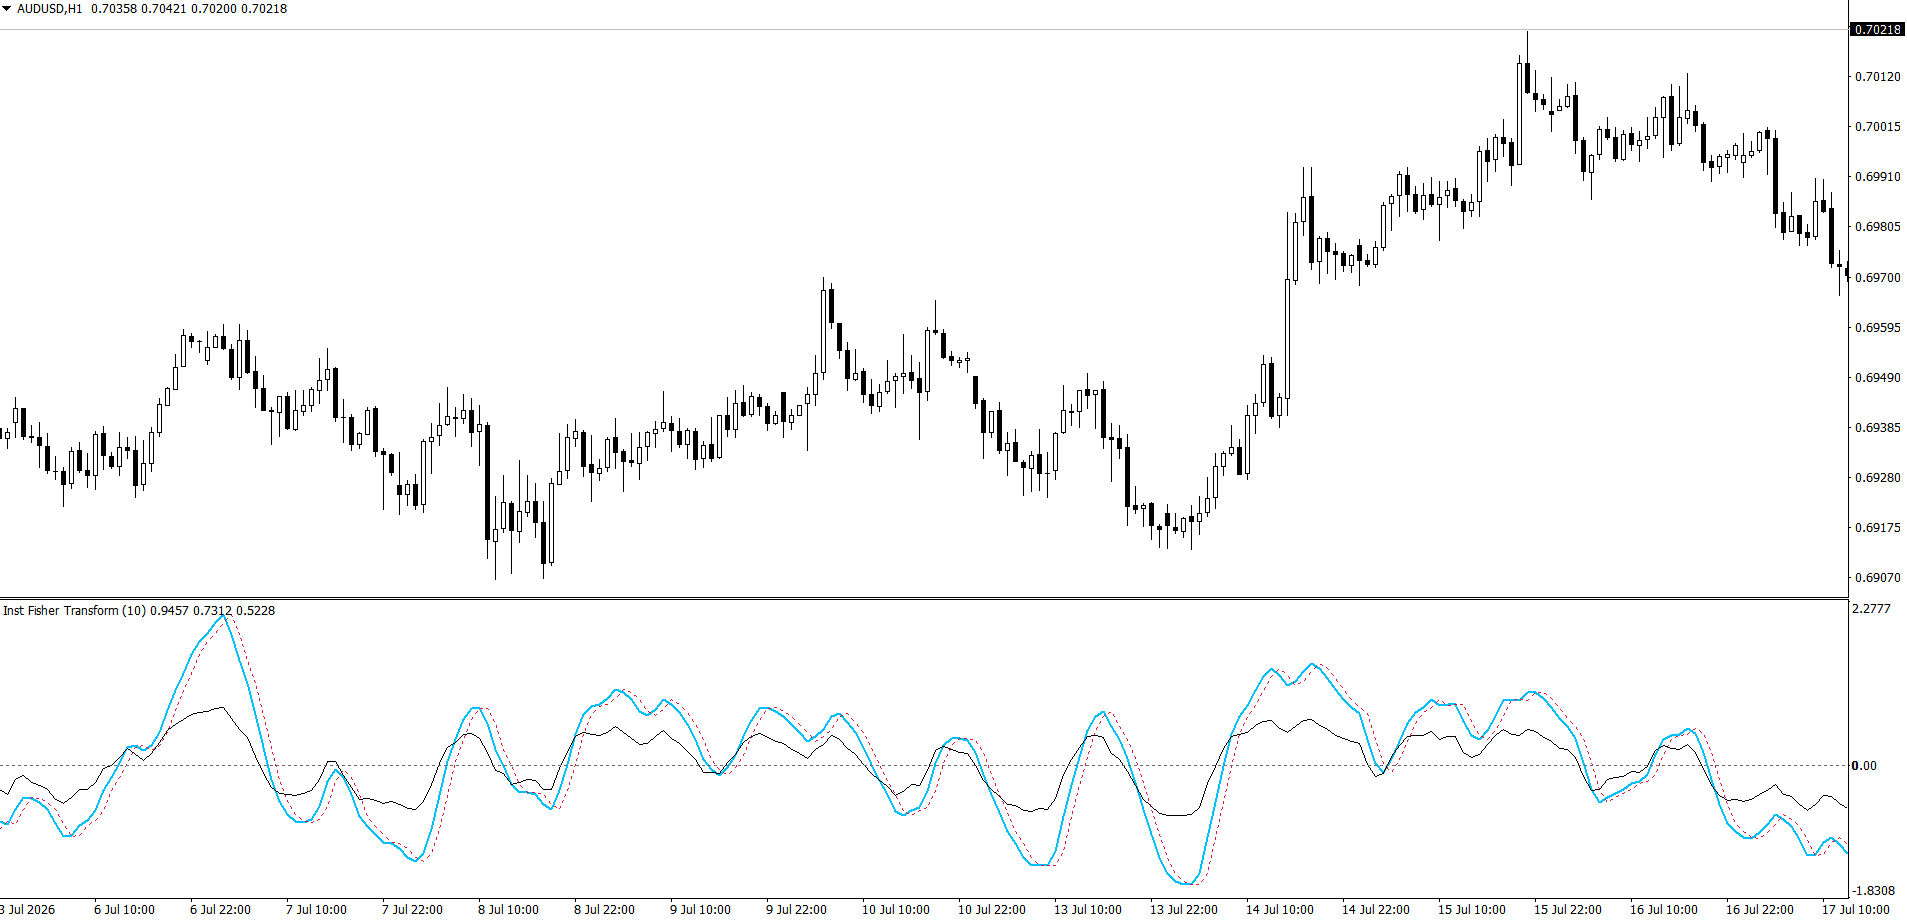
The Institutional Ehlers Fisher Transform alters the Probability Density Function (PDF) of price action. By converting raw price variations into a Gaussian Normal Distribution, the engine cleans up routine market noise around the zero baseline while expanding true statistical outliers into sharp, unmistakable vertical peaks.
-
No Bounded Limits: Unlike RSI, the Fisher Transform is unbounded. Extreme moves don't get squished at an arbitrary "100" ceiling; they stretch proportional to actual momentum.
-
Zero-Lag Sensitivity: Because the transform reshapes price geometry directly rather than averaging historical candles, turning points appear instantly without moving average phase-lag.
Core Architecture & Inputs
-
InpPeriod (Default = 10): The rolling DSP calculation window. A value of 10 balances fast execution speed with reliable signal noise filtration.
-
Gaussian Normalization Engine: Normalizes median price into a $[-1, 1]$ vector before feeding it into the continuous logarithmic transform function $y = 0.5 \cdot \ln\left(\frac{1+x}{1-x}\right)$.
-
Strict MT4 Code Standard: Built with #property strict memory management and reverse-indexing loops to ensure near-zero CPU usage during high-volatility news spikes.
Practical Execution Protocol
-
Attach to Chart: Works exceptionally well on M15, H1, and H4 timeframes across major pairs and metals.
-
Filter the Baseline: Ignore minor oscillations near the zero level.
-
Wait for Extreme Spikes: Watch for the main Fisher line (Blue) to stretch far above or below the baseline into a sharp peak.
-
Take the Entry: Execute your mean-reversion trade on the exact bar where the Blue line crosses back over the Red dotted trigger line.
 External Range Liquidity ERL Market Structure
External Range Liquidity ERL is a custom indicator for MetaTrader 4 designed specifically for traders utilizing Price Action and Smart Money Concepts. This indicator automatically maps the Market Structure and identifies areas where liquidity has been taken, known as a Liquidity Sweep.
BBandsPsar
BBandsPsar is a custom hybrid indicator that fuses Bollinger Bands’ volatility framework with the Parabolic SAR’s trend-following logic. By integrating these two methodologies, it effectively reconciles market volatility with emerging trend dynamics within a single, cohesive tool.
 Quantora Trade Manager MT4 - Professional Position Management Utility
Professional open-source trade management utility for MetaTrader 4. Automatically applies Stop Loss, Take Profit, Break Even and Trailing Stop while providing a modern dashboard for efficient position management.
Quantora Break Even Manager MT4 - Professional Automatic Break Even Utility
Professional open-source Break Even manager for MetaTrader 4. Automatically moves Stop Loss to Break Even using adjustable trigger, offset, Magic Number filtering and a modern Quantora dashboard.