Join our fan page

RSI MA Signal Indicator - indicator for MetaTrader 5
- Views:
- 5371
- Rating:
- Published:
-
 You are missing trading opportunities:
- Free trading apps
- Over 8,000 signals for copying
- Economic news for exploring financial markets
Registration Log inYou agree to website policy and terms of use
If you do not have an account, please register -
 Need a robot or indicator based on this code? Order it on Freelance
Go to Freelance
Need a robot or indicator based on this code? Order it on Freelance
Go to Freelance
A simple and effective signal indicator for MetaTrader 5.
This indicator combines two classic tools, RSI and Moving Average (MA), to identify trend following signals. It is designed as a clean, non-drawing visual tool that is ideal for manual trading or as a source of signals for an Expert Advisor (EA).
EA (EA).
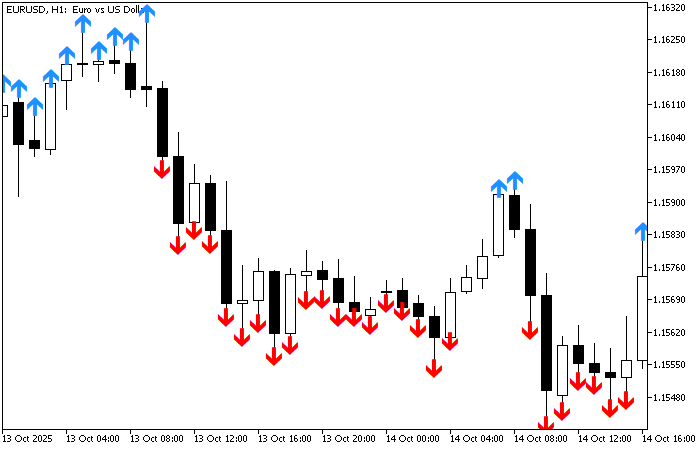
STRATEGY LOGIC
The indicator draws an arrow only when both conditions are met:
Buy signal (Blue arrow):
1. The closing price is OUTSIDE the Moving Average (confirming an uptrend).
2. The RSI value is above the 50 level (confirming the bullish momentum).
Sell Signal (Red Arrow):
1. The closing price is LOWER than the moving average (confirming the downtrend).
2. The RSI value is LOWER than the 50 level (confirming the bearish momentum).
FEATURES
- Clean, commented code.
- All parameters (RSI Period, MA Period) are fully customisable in the input data.
- Uses standard MT5 buffers for signals (ideal for use with iCustom() in an EA).
Translated from Russian by MetaQuotes Ltd.
Original code: https://www.mql5.com/ru/code/65365
 Comment
A simple comment.
HorizontalTrendLines
MT5 version of the indicator https://www.mql5.com/ru/code/25465
Dynamic Gaussian Channel
This indicator builds a dynamic price channel using Gaussian smoothing to determine support and resistance lines. It calculates smoothed high and low price values for a given period, finds their extrema and displays three lines: upper resistance (maximum of smoothed high), lower support (minimum of smoothed low) and the middle line between them, forming an adaptive trading channel.
 Positions Summary Info byPairs
Script for displaying updating data on open positions.