Join our fan page

- Views:
- 7674
- Rating:
- Published:
-
 You are missing trading opportunities:
- Free trading apps
- Over 8,000 signals for copying
- Economic news for exploring financial markets
Registration Log inYou agree to website policy and terms of use
If you do not have an account, please register -
 Need a robot or indicator based on this code? Order it on Freelance
Go to Freelance
Need a robot or indicator based on this code? Order it on Freelance
Go to Freelance
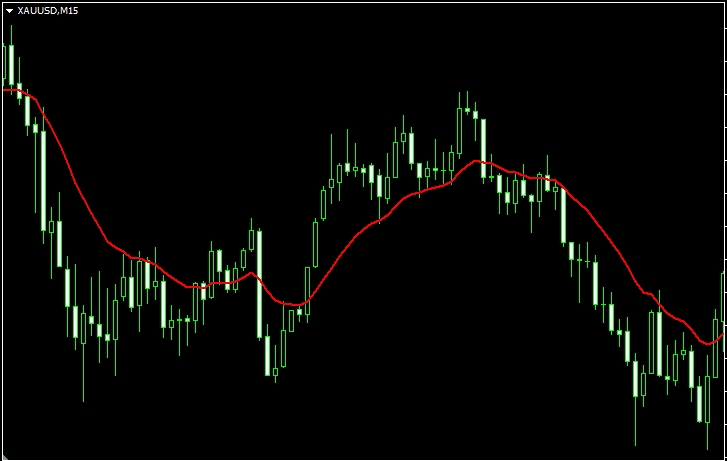
This is a simple indicator to calculate moving averages based on timeframe that currently viewed.
The calculations are generally based on timeframe window and moving average's period defined.
The following chart is on M15 timeframe shows an Exponential Moving Average on close price with period of 16.
while this following chart is on the M5 timeframe, shows an Exponential Moving Average on close price with period of 48.
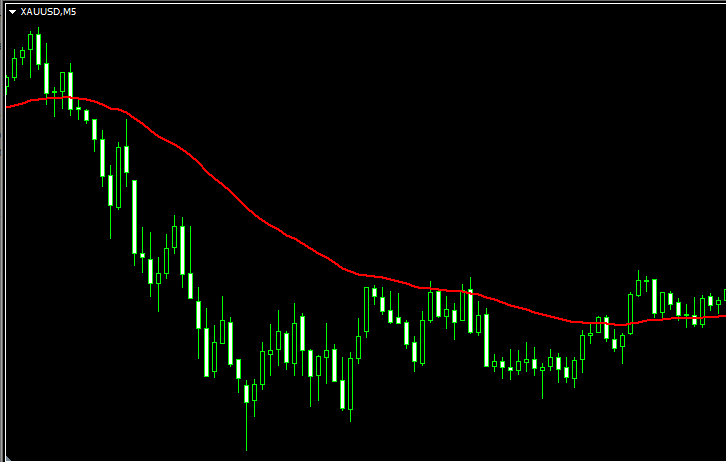
both charts shows equal moving average relative to market structure on different the time frame.
 Surfing - 2 EMA strategy
This is a pretty simple startegy that follows trend. Recommended time frams is D1. when close price brakes up the EMA build based on high prices given that RSI is above 55 and RSI is above its Moving average - we buy. when close price brakes down the EMA build based on low prices given that RSI is below 45 and RSI is below its moving average - we sell. system closes previose trade if there is opposite signal system uses take profit and stop loss as well as trailing stop
 Auto Scale ZigZag
ZigZag with automatic step size detection for changing wave direction.
Day of Week
The indicator shows the names of the days of the week as text labels on the chart.
Symbol Swap Panel Utility
Symbol Swap Panel: Effortlessly switch the active symbol on your chart while simultaneously adding the new symbol to Market Watch. This tool ensures seamless integration and access to real-time market data, optimizing your trading workflow.