Join our fan page
- Views:
- 9745
- Rating:
- Published:
- Updated:
-
Need a robot or indicator based on this code? Order it on Freelance Go to Freelance
Author: Andrey N. Bolkonsky
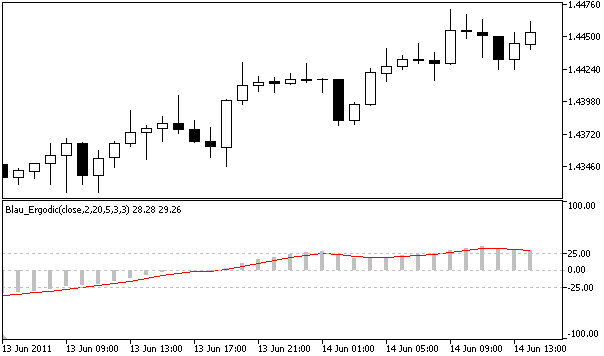
Ergodic Oscillator by William Blau is based on True Strength Index indicator (see Momentum, Direction, and Divergence: Applying the Latest Momentum Indicators for Technical Analysis).
To indicate the trend reversal, the signal line is used.
- Buy signal: upward crossover of the signal line.
- Sell signal: downward crossover of the signal line.
The signal line is calculated using the smoothing of a base line (Ergodic, True Strength Index), the averaging period is equal to the last averaging period of a base line.
The trend is upward when base line above the signal line, the trend is downward when base line below the signal line.
- WilliamBlau.mqh must be placed in terminal_data_folder\MQL5\Include\
- Blau_Ergodic.mq5 must be placed in terminal_data_folder\MQL5\Indicators\

Calculation:
Ergodic oscillator is calculated by formula:
Ergodic(price,q,r,s,u) = TSI(price,q,r,s,u)
SignalLine(price,q,r,s,u,ul) = EMA( Ergodic(price,q,r,s,u) ,ul)
where:
- Ergodic() - base line - True Strength Index TSI(price,q,r,s,u);
- SignalLine() - signal line - exponentially smoothed moving average with period ul, applied to Ergodic;
- ul - averaging period of a signal line (according to Willam Blau, it must be equal to last averaging period (>1) of the Ergodic line. For example Ergodic(price,q,r,s,u)=Ergodic(price,2,20,5,1), in this case ul=s=5.
Input parameters:
- graphic plot #0 - Ergodic (True Strength Index):
- q - Momentum averaging period (by default q=2);
- r - period of the 1st EMA, applied to Momentum (by default r=20);
- s - period of the 2nd EMA, applied to result of the first smoothing (by default s=5);
- u - period of the 3rd EMA, applied to result of the second smoothing (by default u=3);
- graphic plot #1 - Signal line:
- ul - Smoothing period of the signal line, applied to base line (by default ul=3);
- AppliedPrice - price type (by default AppliedPrice=PRICE_CLOSE).
Note:
- q>0;
- r>0, s>0, u>0. If r, s or u =1, smoothing is not used;
- ul>0. If ul=1, the signal and base lines are the same;
- Min. rates =(q-1+r+s+u+ul-4+1).
Translated from Russian by MetaQuotes Ltd.
Original code: https://www.mql5.com/ru/code/362
 Blau_TSI
True Strength Index (TSI) indicator by William Blau.
 Blau_Mtm
Momentum Indicator by William Blau.
 Stochastic Indicator Blau_TStoch
Stochastic Indicator (smoothed q-period Stochastic) by William Blau.
 Stochastic Index Blau_TStochI
Stochastic Index Indicator (normalized smoothed q-period Stochastic) by William Blau.