Join our fan page
- Views:
- 5919
- Rating:
- Published:
- Updated:
-
Need a robot or indicator based on this code? Order it on Freelance Go to Freelance
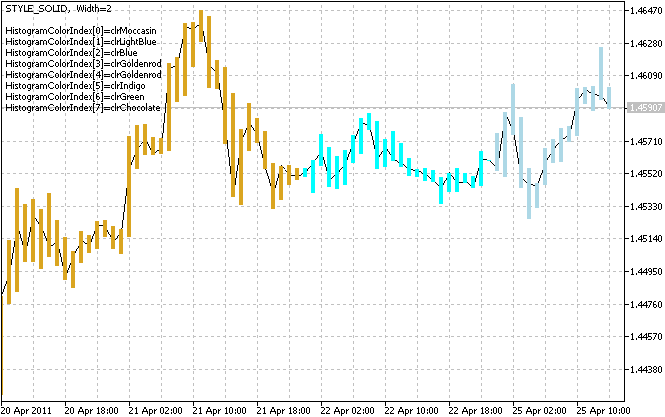
This indicator is a demo of DRAW_COLOR_HISTOGRAM2 drawing style.
For each bar it plots a section between the Open and Close prices. Three indicator buffers are used: the first contains the High values of the bar, the second contains the Low prices of the bar, the third buffer contains the color indexes.
The colors, width and line style are changed randomly after N ticks. The initial properties of the plot1 graphic plot are defined using the #property preprocessor directive, further these properties changed randomly (see OnCalculate() function).
See also The Drawing Styles in MQL5

Translated from Russian by MetaQuotes Ltd.
Original code: https://www.mql5.com/ru/code/344
 DRAW_COLOR_HISTOGRAM
The DRAW_COLOR_HISTOGRAM drawing style is used to plot color histograms.
 DRAW_COLOR_SECTION
The DRAW_COLOR_SECTION drawing style is used to plot sections with different colors, the colors are specified in the color buffer.
 DRAW_COLOR_ARROW
The DRAW_COLOR_ARROW drawing style plots the color arrows (symbols from Windings font).
 DRAW_COLOR_ZIGZAG
The DRAW_COLOR_ZIGZAG style draws lines of different colors by values of two indicator buffers. This is the color version of the DRAW_ZIGZAG style and allows you to specify individual color for each line from predefined color set.