Join our fan page

Stoch RSI MT4 - indicator for MetaTrader 4

if you're looking for someone to support you even after the job is done then I'm your guy :)
Customer services I offer:
- Source code providing
- Clean coding (self explanatory)
- Reliable programming
- Quick turnaround
- Views:
- 51600
- Rating:
- Published:
- Updated:
-
 You are missing trading opportunities:
- Free trading apps
- Over 8,000 signals for copying
- Economic news for exploring financial markets
Registration Log inYou agree to website policy and terms of use
If you do not have an account, please register -
 Need a robot or indicator based on this code? Order it on Freelance
Go to Freelance
Need a robot or indicator based on this code? Order it on Freelance
Go to Freelance
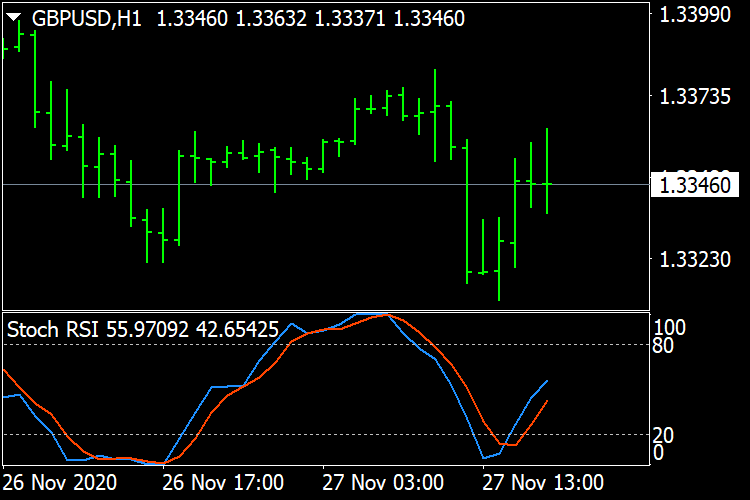
The Stochastic RSI indicator (Stoch RSI) is essentially an indicator of an indicator. It is used in technical analysis to provide a stochastic calculation to the RSI indicator. This means that it is a measure of RSI relative to its own high/low range over a user defined period of time. The Stochastic RSI is an oscillator that calculates a value between 0 and 1 which is then plotted as a line. This indicator is primarily used for identifying overbought and oversold conditions.
 Fibonacci Potential Entry - MT4
The 8 effective steps to build a robust day trading plan using Fibonacci retracement
Doulble MA Cross Draw Histogram
Use the intersection of two moving average lines to draw a vertical line
Identify potential Trends/Range (Pivot Points) - MT4
This script was developed in order to help us detect if a chart is actually trending or going nowhere.
AverageRangeLines_v1.6
ADR,AWR,AMR,Draws Average Range Lines