Join our fan page

- Views:
- 84522
- Rating:
- Published:
- Updated:
-
 You are missing trading opportunities:
- Free trading apps
- Over 8,000 signals for copying
- Economic news for exploring financial markets
Registration Log inYou agree to website policy and terms of use
If you do not have an account, please register -
 Need a robot or indicator based on this code? Order it on Freelance
Go to Freelance
Need a robot or indicator based on this code? Order it on Freelance
Go to Freelance
Author
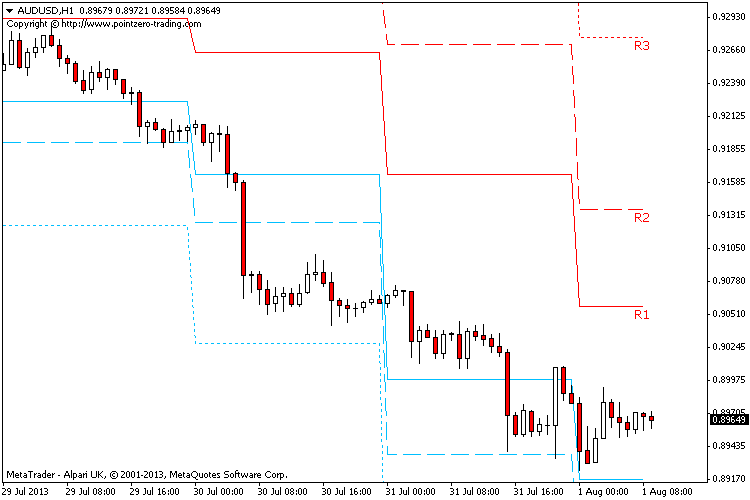
The developer of this indicator is Arturo Lopez, founder of Point Zero Trading Solutions.
A pivot point analysis is often used in conjunction with calculating
support and resistance levels, similar to a trend line analysis. In a
pivot point analysis, the first support and resistance levels are
calculated by using the width of the trading range between the pivot
point and either the high or low prices of the previous day. The second
support and resistance levels are calculated using the full width
between the high and low prices of the previous day.
Why another Pivot Points indicator?
There are a lot of Pivot Points indicators available, but none of them suit my needs: most of them are very heavy and have a lot of stuff I don't need, others won't display past pivot points and none of them allowed me to select the reference timeframe. I wanted a very light indicator which allowed me to choose the reference timeframe for historic testing purposes. For example, I might want to see monthly pivot points and take a look at them for the last two years, and I couldn't with other standard indicators. So I created this one.
 Positive Volume Index
This indicator, recognizing trends in an early stage, can be used to get ready for a break-out scenario.
Market crash alert when you sleep
Indicator that shows you market push and future 80% of next big trend.
 Сlose positions by result, time passed or at specific time
This EA will watch your open positions and close the ones that meet the preset conditions.
 Close All
This scrip will close all your open positions in your MT4. You just need to drag it to the chart.