Join our fan page
- Views:
- 55393
- Rating:
- Published:
- Updated:
-
Need a robot or indicator based on this code? Order it on Freelance Go to Freelance
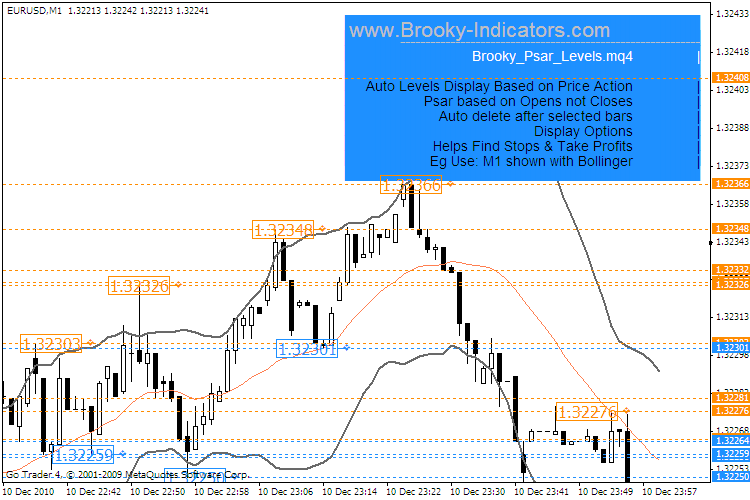
This indi will draw the levels and then delete if older than your selected bars. The turn is calculated on above/below opens not closes as that seems to get most of the turns and this makes it slightly different than just the dots from a programing point of view.
I prepared a video to show it in use with Bollinger bands as this seemed to illustrate how the indi worked quite well. You can have a look if you like here>>. Parabolic S&R Levels Video.
Very basically the more previous crosses in bars past that are close together show the strength of the resistance/support level. I have noticed that price tends to want to break
into clear ground which is easy to see as clear chart area.

 Donchian Channel with Fibbed Levels and Alerts
A support and resistance indicator to assist in setting stop losses and take profits with any strategy.
 AggM
AggM
AggM is a composite trend and mean-reversion indicator.
 Doda-Donchian v2 mod
This is the Doda-Donchian v2 created by Gopal Krishan Doda, but when I use this indicator, I found some error and I have to fix it. also adding features price and candle time. Doda-Donchian v2 mod fix-->Fix Stop Loss Color
 BPA - D1 London Session
Ricx - 1st indicator submit This indicator will plot EURUSD D1 candlestick chart on white or other bright background.