JET Big Trades PRO is a paid indicator for MetaTrader 5 that draws a bubble at the price of each big trade, on the candle where it happened, with the aggressor side and the size. Only trades above the size filter you choose become bubbles, so the chart shows just the big ones. It adds a panel with the buy and sell totals of the day, alerts and data for Experts. It works on futures and stocks of any exchange (e.g. B3, CME and others) and, in estimated mode, on forex, CFDs and metals. It is an indicator only: it never opens, closes or changes orders.
What it shows
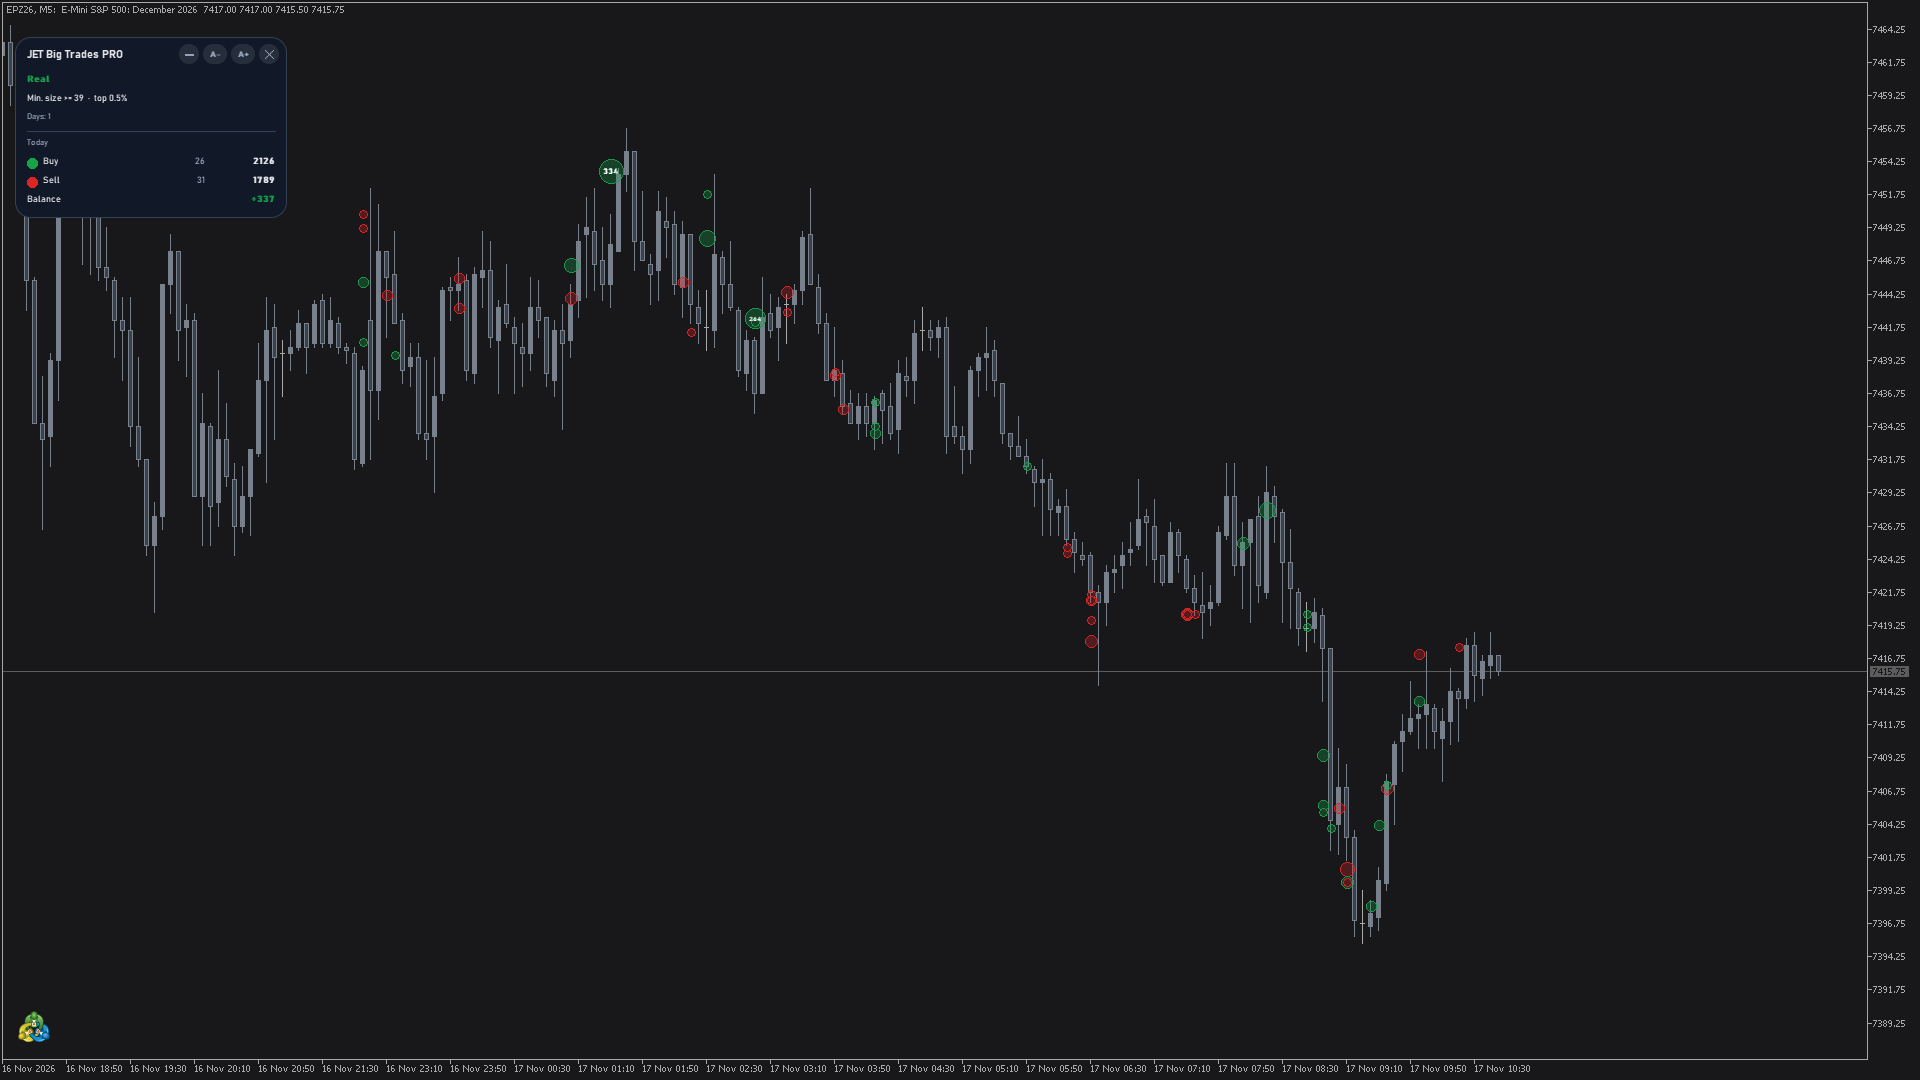
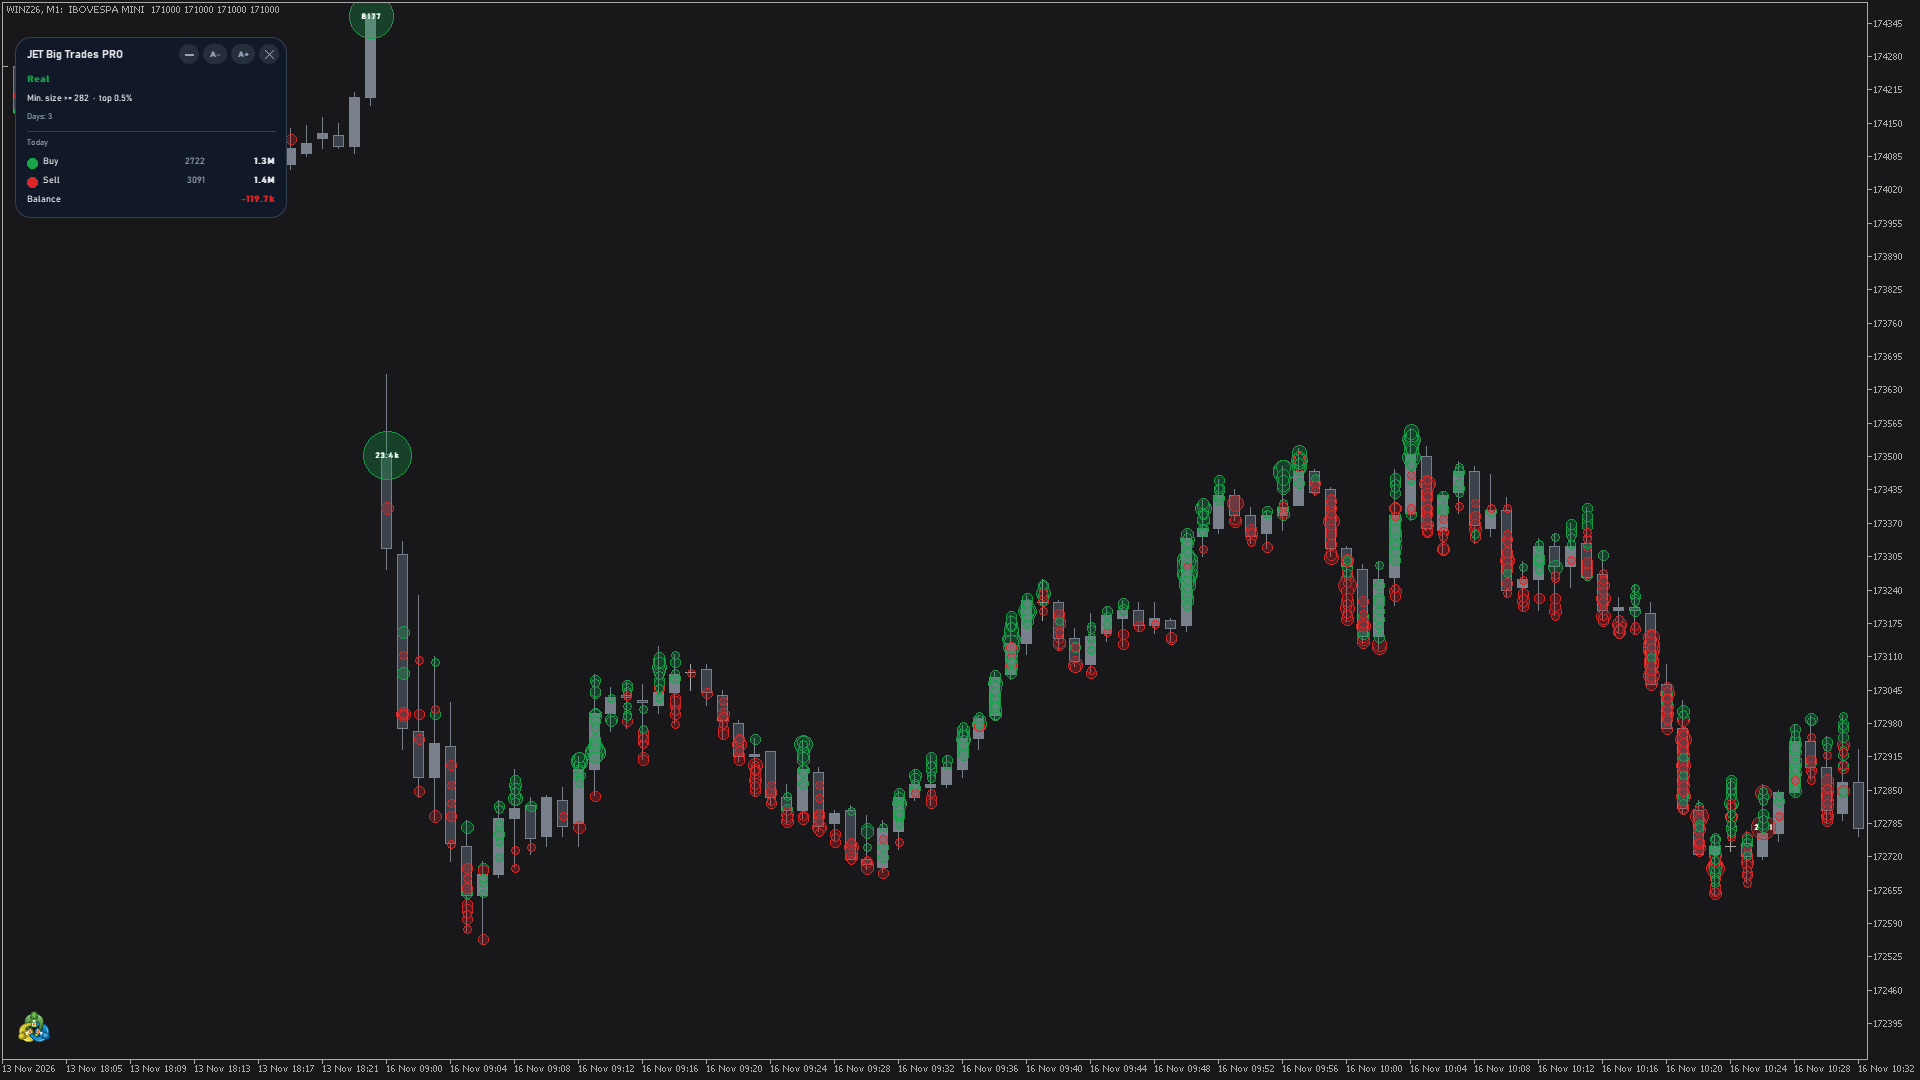
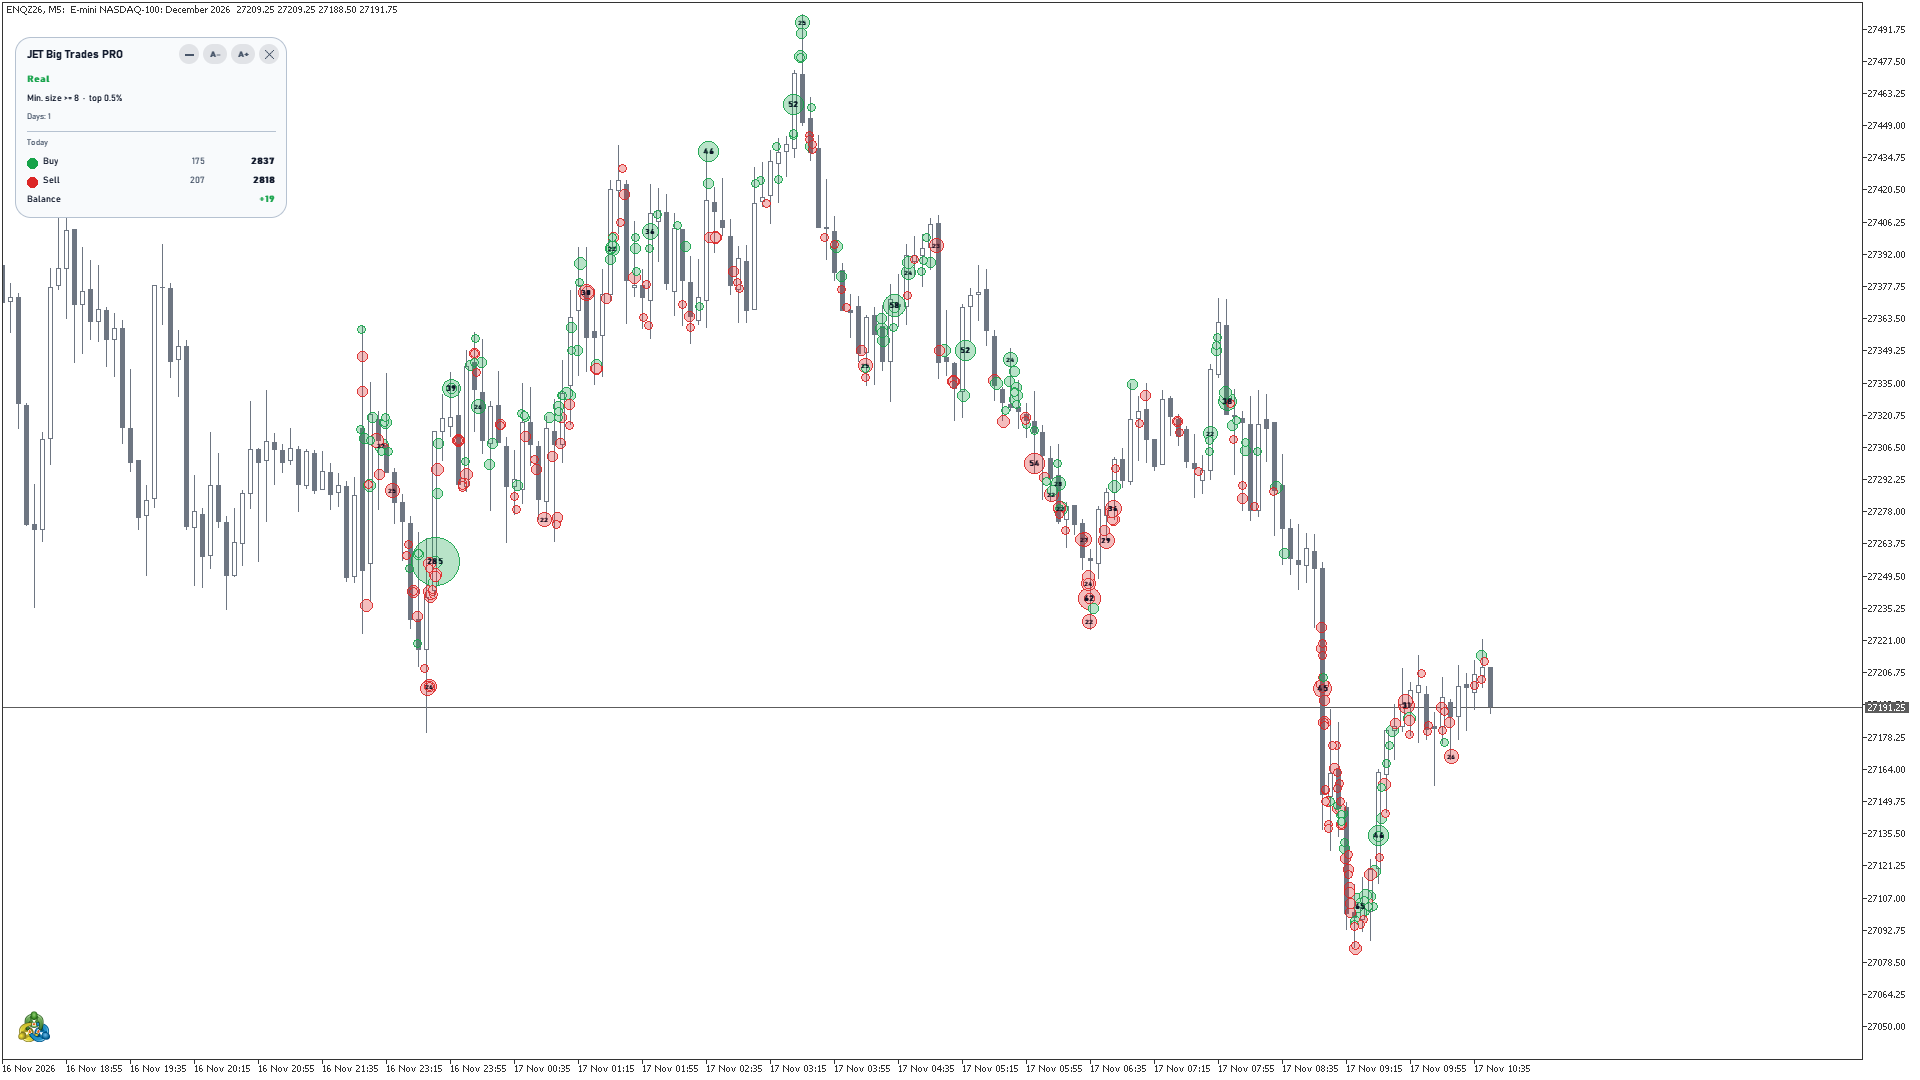
- Bubbles at the trade price: green when the buyer was the aggressor, red when the seller was, grey when the side is unknown. The fill is translucent, with a ring, so the candles stay visible.
- Size: the bubble area follows the volume, between the minimum and the maximum radius. The scale is fixed for the day: a bubble keeps its size when you zoom or scroll.
- Number inside: the volume in short form (e.g. 12.4k or 1.2M) appears inside the bubbles where it fits entirely.
- Order: smaller bubbles are drawn over the larger ones, so none is hidden.
- Grouping: trades at the same price and side within a few milliseconds (100 ms by default) become one bubble with the total volume.
- Details on mouse hover: rest the mouse on a bubble to see Time (with milliseconds), Price, Volume, Side and Trades (the number of trades in the group; Ticks in estimated mode). For a sweep, the price range appears in parentheses.
- No repainting: bubbles on closed candles never change. On the candle in progress bubbles are only added, each one already with its final volume.
Real or estimated data
- Real: where the broker sends the trades with the aggressor side (futures and stocks of any exchange, e.g. B3, CME and others), the bubbles are real trades and the side is real.
- Real (side estimated): the broker sends the trades with their volume but without a reliable side. The volume is real and the side is estimated.
- Estimated (tick bursts): forex, CFDs and metals have no trades on MetaTrader 5. The bubbles are bursts of quotes in the same direction, and the size is the number of quotes, not a traded volume.
- The mode is always visible at the top of the panel (Real in green, the other two in amber) and is also available to Experts (buffer 10). With the input Data = Always estimated, the estimated mode is used even where real trades exist.
How to add it to the chart
- Open the Navigator (Ctrl+N) and find JET Big Trades PRO under Indicators > Market.
- Drag it to the price chart (or double-click it), adjust the Inputs tab if you wish and click OK.
- It works on any symbol with tick history, on timeframes from M1 to D1. Above D1 the panel shows "Works up to the D1 chart".
- At the first load the indicator reads the ticks day by day: the panel shows "Loading ticks: day 2 of 6", for example, and the bubbles appear day by day. The terminal stays responsive during the load.
- To remove it, click [X] on the panel, or open the indicator list (Ctrl+I), select it and click Delete.
The panel
- Header: product name and the buttons [–] (minimize), [A-] and [A+] (panel size) and [X] (remove the indicator). Drag the panel by its header to put it anywhere on the chart.
- Data mode: Real (green), Real (side estimated) or Estimated (tick bursts) (amber).
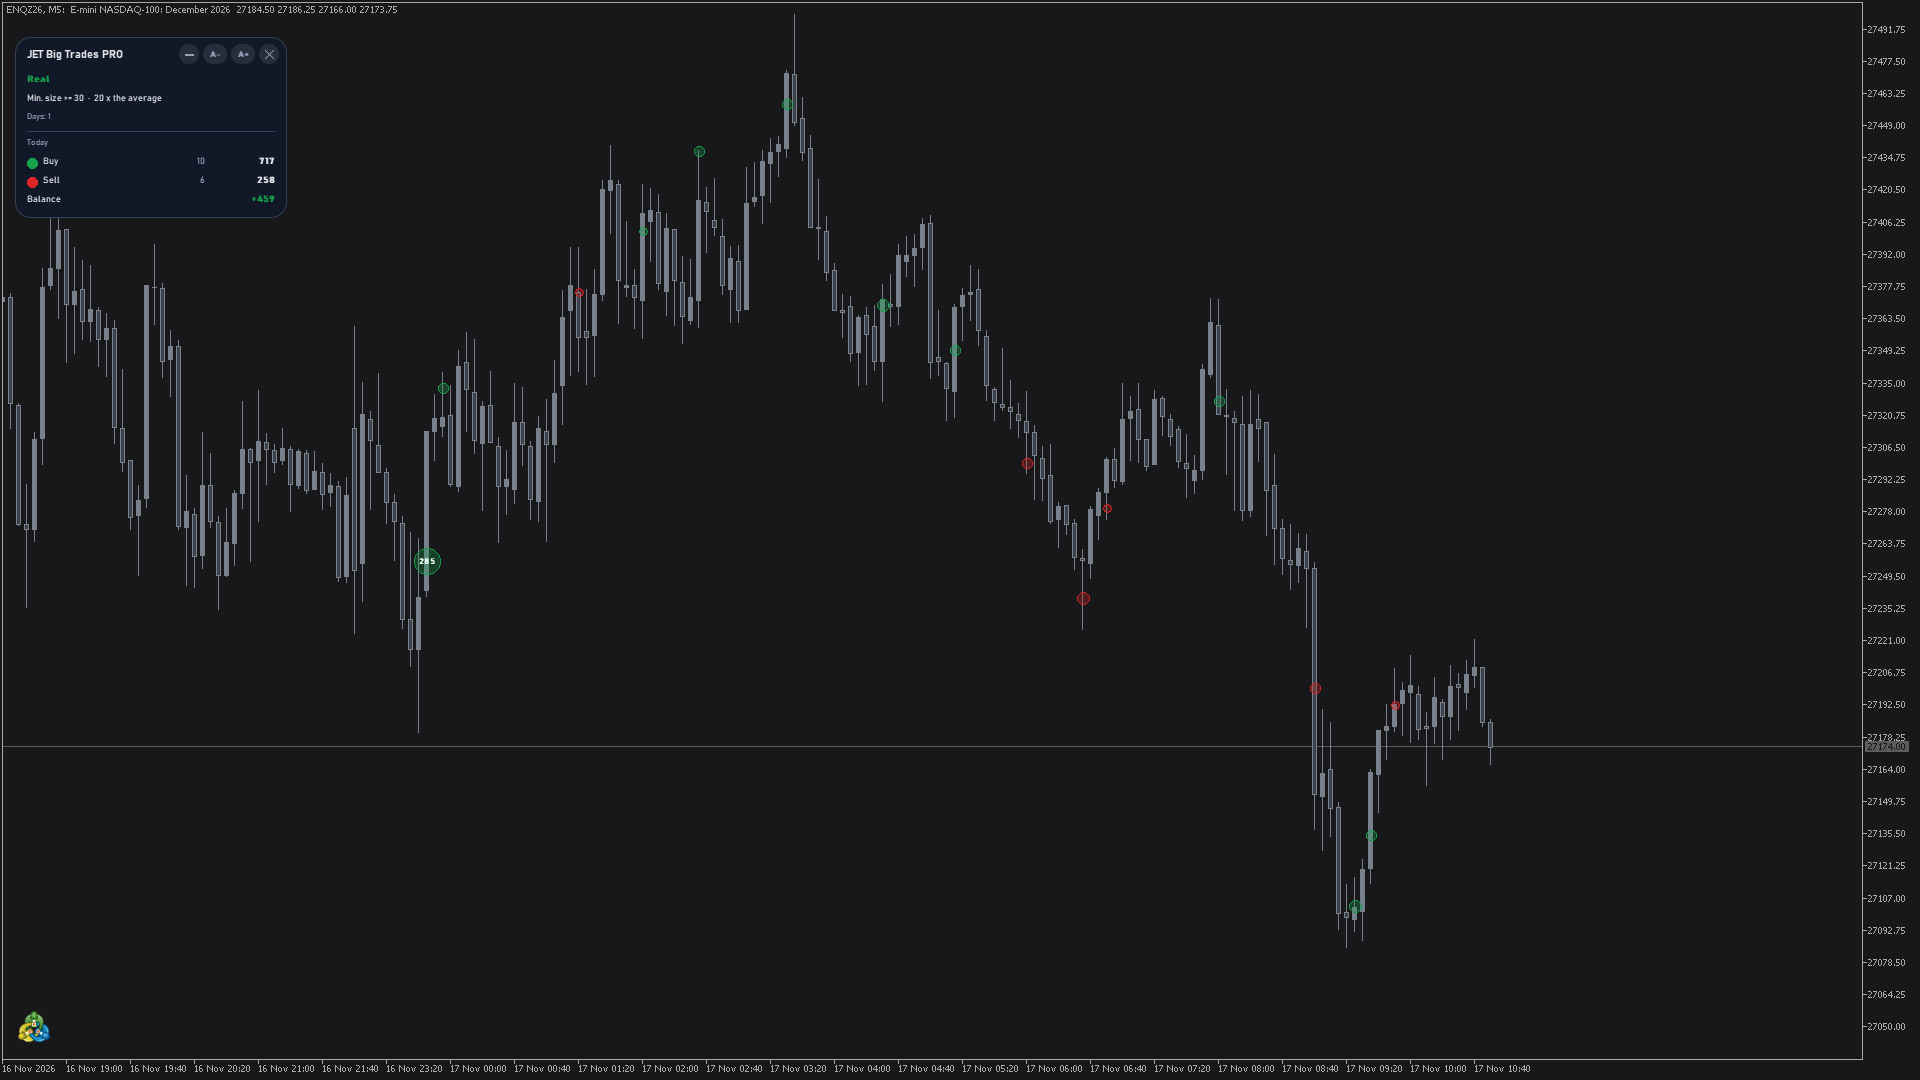
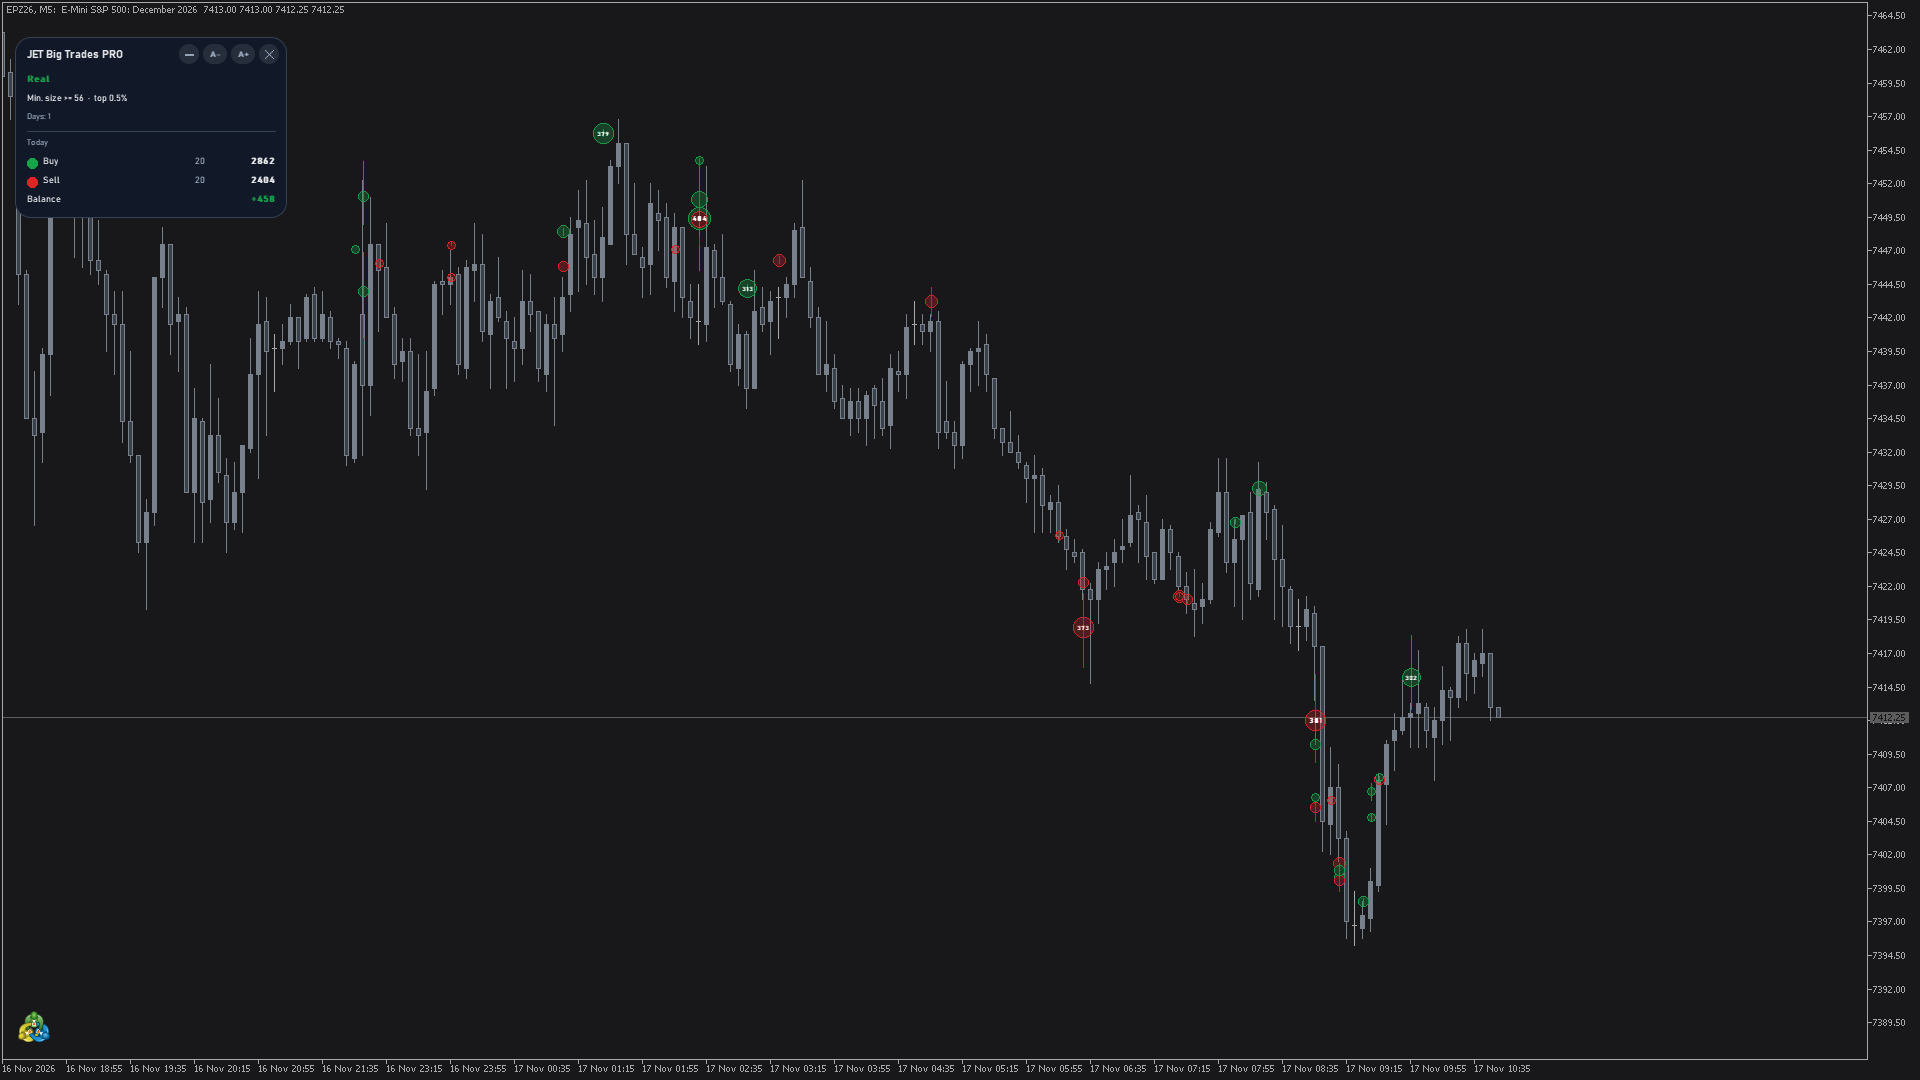
- Filter: the minimum size of the day and the filter in use, e.g. "Min. size >= 50 · top 0.5%", "20 x the average" or "fixed". The size is rounded to the volume step of the symbol (whole contracts on futures).
- Days: number of days shown; during the load, the progress.
- Today: Buy and Sell, each with the number of bubbles and their volume, and Balance (buy volume minus sell volume), green when positive and red when negative.
- Notices in amber when needed: "provisional limit", "Days without ticks", "Filter too low: largest 20,000 kept" and others (see Tips).
Inputs
Size filter
- Size filter = Percentile (largest trades). Options: Percentile (largest trades), Absolute size, Multiple of the average trade size. Chooses which trades become bubbles.
- Percentile (99.5 = the largest 0.5% of the trades) = 99.5. Lower values show more bubbles (99 = the largest 1%); higher values only the very largest.
- Absolute minimum size (0 = automatic by percentile) = 0. Used with Absolute size: the minimum size in lots or contracts (number of quotes in estimated mode). With 0, the percentile is used.
- Multiple of the average trade size = 20. Used with Multiple of the average trade size: a trade becomes a bubble from this multiple of the average size.
- Previous sessions used as reference (1-5) = 3. The percentile and the average come from these previous sessions and stay fixed for the whole day, so today and the history follow the same rule.
Grouping
- Grouping = Same price and side within the window. Options: Trade by trade (each trade is a candidate bubble); Same price and side within the window; Sweep: same side, successive prices within the window (one bubble for a sequence of trades on the same side across neighboring prices).
- Grouping window (ms, 0-5000) = 100. Some brokers already deliver the trades aggregated; the indicator shows what the broker sends.
History
- Days of history, today included (1-10) = 3. More days take longer to load.
- Data = Automatic (real trades when the broker sends them). Other option: Always estimated (tick bursts).
Bubbles
- Minimum radius (px at 100%) = 4 and Maximum radius (px at 100%) = 24. The area of each bubble follows its volume between these two limits.
- Fill transparency (%) = 70.
- Volume inside the bubble = true. The number is drawn only where it fits entirely.
- Place the bubble by its time inside the candle = false. When true, on charts above M1 the bubble moves from left to right inside the candle according to the time of the trade.
- Maximum bubbles per candle (0 = all) = 0. Keeps only the largest bubbles of each candle; useful on higher timeframes.
Panel
- Show the panel = true.
- Theme = Automatic (chart background). Other options: Dark, Light. It also applies to the details box.
- Panel size (%) = 100 (50 to 300), also adjustable with [A-] and [A+].
- Language = Terminal language, or one of the 11 languages.
Colors
- Buy aggressor = green; Sell aggressor = red; Side unknown = grey.
Alerts
Alerts fire only for bubbles that appear live, never for the history. Group Alerts (live bubbles only):
- Big trade = Popup + Sound. Fires when a buy or sell bubble reaches the Big trade size. Message, e.g.: "Big buy trade: 120 at 5012.25".
- Big trade size (0 = 2 x the minimum size) = 0. Type a value in lots or contracts to fix it.
- Sequence of bubbles on the same side = Off, with Sequence: bubbles = 3 and Sequence: within seconds = 60. Message, e.g.: "3 big sell trades in 60 s".
- Big trades balance of the day crosses zero = Off. Message: "Big trades balance of the day turned positive" (or negative).
- Modes: Off, Popup, Sound, Smartphone notification, Popup + Sound, Notification + Sound, Popup + Notification, Popup + Sound + Notification.
- Sound = alert (a sound of the terminal). Also send e-mail = false; when true, each alert that is on also sends an e-mail. Minimum seconds between alerts of the same kind = 30.
- Push notifications and e-mail must be set up in Tools > Options (Notifications and Email tabs). Alert messages use the panel language.
Data for Experts (iCustom)
The indicator has 11 buffers with one value per candle, readable with iCustom and CopyBuffer. They are not drawn on the chart.
| Buffer | Content |
|---|---|
| 0 | Volume of the largest bubble of the candle (0 if none) |
| 1 | Price of the largest bubble |
| 2 | Side of the largest bubble: +1 buy, -1 sell, 0 unknown |
| 3 | Number of buy bubbles in the candle |
| 4 | Number of sell bubbles in the candle |
| 5 | Volume of the buy bubbles |
| 6 | Volume of the sell bubbles |
| 7 | Big trades balance of the candle (buffer 5 minus buffer 6) |
| 8 | Big trades balance of the day up to the candle |
| 9 | Minimum size in use for the day |
| 10 | Data mode: 1 real, 2 estimated, 3 real with side estimated |
- Closed candles never change. On the candle in progress (index 0), buffers 0 to 8 only grow.
- Empty values are EMPTY_VALUE, on candles without loaded ticks (outside the days of history).
- The buffers follow the inputs of the indicator (filter, grouping, days); iCustom without inputs uses the defaults.
- Example: handle = iCustom(_Symbol, PERIOD_CURRENT, "Market\\JET Big Trades PRO"); then read buffer 0 of bar 1 with CopyBuffer: a value above 0 means that the last closed candle had at least one bubble, and buffer 2 gives its side.
- In the Data Window (Ctrl+D) the values appear as Largest bubble volume, Largest bubble price, Buy bubbles and so on.
Free or PRO?
The free JET Big Trades draws the same bubbles, with the Real and Estimated modes, the percentile or absolute size filter, up to 2 days of history and grouping at the same price and side within 100 ms. Its panel shows the data mode, the minimum size and the loading progress, with [–] and [X], dark theme and 11 languages. JET Big Trades PRO adds:
- the filter by multiple of the average trade size and the choice of 1 to 5 reference sessions;
- grouping trade by trade, by window from 0 to 5,000 ms or by sweep;
- up to 10 days of history;
- details on mouse hover, placement by time inside the candle and the limit of bubbles per candle;
- the buy, sell and balance totals of the day in the panel, the light and automatic themes and the [A-] [A+] buttons;
- alerts and the 11 buffers for Experts.
Tips and frequent questions
- Too many bubbles? Raise the percentile (e.g. 99.8) or switch to Absolute size with a larger value; on higher timeframes, also set Maximum bubbles per candle. Too few? Lower the percentile (e.g. 99).
- Absolute size with 0: with Absolute minimum size = 0 the percentile is used. Type a size to fix the filter; the panel then shows "fixed".
- "provisional limit": there are not yet enough previous sessions with ticks to set the filter of the day (new symbol or short tick history). It goes away as the history grows; Absolute size does not depend on it.
- "Warm-up: bubbles start next session": there is no previous session to use as reference (e.g. at the start of a Strategy Tester run); the first session serves only as reference.
- "Filter too low: largest 20,000 kept": the filter lets too many trades through in one day; raise the percentile or the absolute size.
- "No trades on this symbol" or "Days without ticks": the broker has no tick history for that symbol or those days. Check that the symbol has ticks in the terminal or reduce Days of history.
- Trading day: on symbols with a daily pause and an evening session (e.g. CME futures), the day of the indicator starts with the evening session, as the trading day of the exchange; on other symbols it is the calendar day. The filter of the day and the balance of the day follow it.
- On M5 and above: turn on Place the bubble by its time inside the candle to see when, within the candle, each big trade happened.
- Reading the bubbles: they show where big trades were executed and on which side, for example a cluster of large sell bubbles at a high or large buy bubbles absorbed without price progress. They describe what already happened; they do not forecast the next move.
Download
- JET Big Trades PRO: bubbles of the big trades, panel with the totals of the day, alerts and data for Experts.
- JET Big Trades: free version, with up to 2 days of history, without alerts and data for Experts.
Questions and suggestions: send me a private message through my MQL5 profile.
Trading involves risk of loss. The indicator shows market information; it does not forecast prices or guarantee results. In estimated mode the bubbles are bursts of quotes, not trades.