
When Delta Betrays Price: 6 Real Trades with Delta Fusion Pro 11.0

Get Delta Fusion Pro 11.0: MetaTrader 5 version · MetaTrader 4 version
Price prints a new high, but the buyers have already stopped pushing: that is a divergence between price and delta, the signal Delta Fusion Pro 11.0 builds everything else on. Here is how to read it, with six real Nasdaq 100 trades that reached their target.
Divergence in brief
- Regular: price makes a new low (or high), delta does not. Sellers (or buyers) are running out of steam: look for a reversal.
- Hidden: price does not make a new extreme, delta does. The opposite side is pushing but cannot move price: look for continuation.
Delta Fusion Pro draws the arrow only once the swing is confirmed on closed bars, so it never repaints. Thresholds are calculated automatically for each instrument and timeframe, and the arrow colour shows the strength: weak, medium or strong.
The confirmations
The divergence tells you the pressure is shifting; the other functions tell you whether it is time to get in.
e to get in.
| Function | What to look for |
|---|---|
| Imbalance | A blue or red dot in the direction of the trade, close to the arrow |
| Net Delta | The gold line crossing zero in the direction of the divergence |
| Impulse, exhaustion, confluence | Price already moving the right way; confluence combines divergence and impulse into a single signal, with alerts |
| VWAP, POC, Delta Profile | Price on the right side of the VWAP, or the VWAP beyond the target; the levels where buyers and sellers prevailed |
| Multi-timeframe and panel | The MTF row on the higher timeframes; counters, last signal and CSV export for your trading journal |
Rules used in the examples: entry at the open of the bar after the arrow; stop beyond the divergence swing plus a small margin; target at 1.5 times the risk. On the charts, the red box is the stop zone and the green box is the target zone.
Rules used in the examples: entry at the open of the bar after the arrow; stop beyond the divergence swing plus a small margin; target at 1.5 times the risk. On the charts, the red box is the stop zone and the green box is the target zone.
Six trading examples with charts
All examples come from the Nasdaq 100 CFD (XUSTEC) between August and October 2026, on M1, M15 and H1, in broker server time (16:30 is the Wall Street open). The average spread of 0.95 points is included in the results, which are expressed in R, i.e. multiples of the risk.
Example 1 · M1 · regular bullish, medium
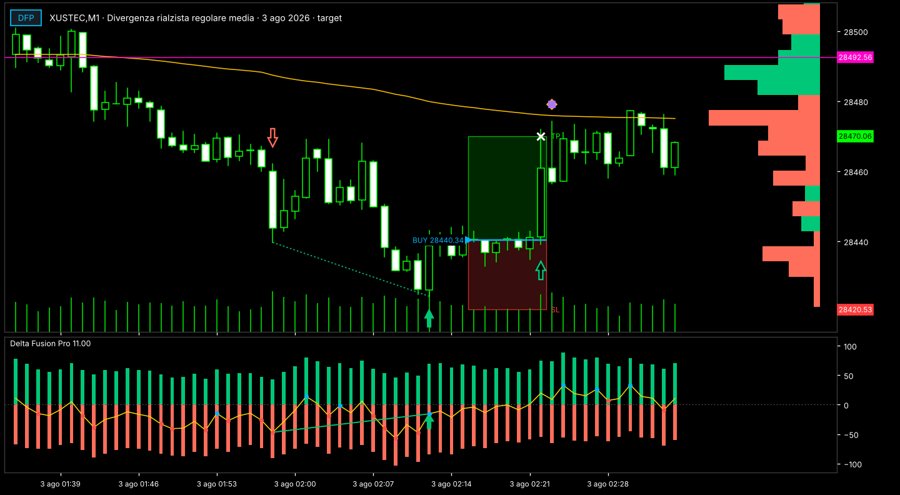
The divergence. At 01:58 price makes a low at 28439.71 with delta −46.8. Then, at 02:12, it goes lower, to 28424.33, but delta is −15.6: sellers are pushing less than before. The green arrow appears at 02:15, when the swing is confirmed.
The confirmations.
- Buy imbalance at 02:12 (158 contracts bought vs 30): blue dot on the Net Delta line.
- VWAP at 28478.52, 38 points above price and beyond the target: the VWAP pulls price in the direction of the trade.
The trade.
- Entry: BUY at 28440.34 at 02:16 on 3 August, open of the bar after the arrow.
- Stop: 28420.53, below the divergence low (28424.33) minus the margin (3.8 points). Risk: 19.81 points.
- Target: 28470.06, i.e. 1.5 times the risk from entry.
- Result: target hit at 02:22, after 7 bars: +1.45 R net of spread.
Example 2 · M15 · regular bullish, strong
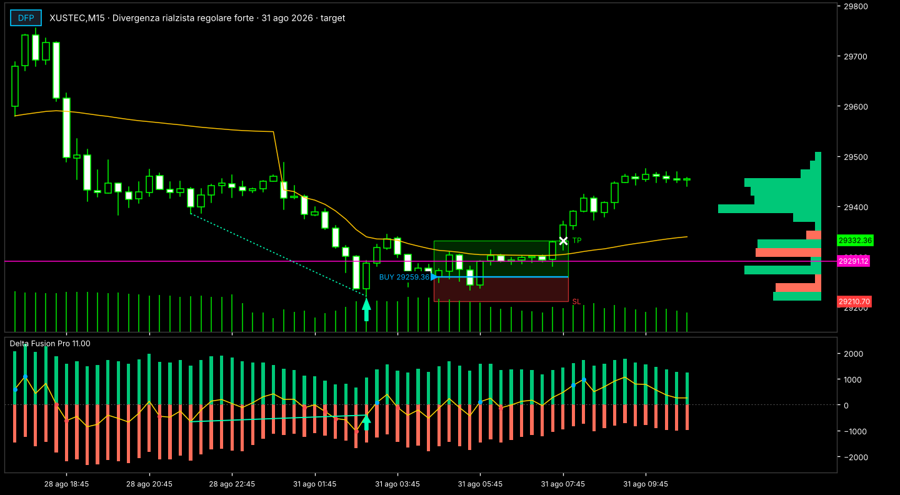
The divergence. On 28 August at 21:45 price makes a low at 29385.82 with delta −659. Then, on 31 August at 03:00, it goes lower, to 29221.00, but delta is −403: sellers are pushing less than before. The green arrow appears at 04:30, when the swing is confirmed.
The confirmations.
- Buy imbalance at 03:15 (2692 contracts bought vs 420): blue dot on the Net Delta line.
The trade.
- Entry: BUY at 29259.36 at 04:45 on 31 August, open of the bar after the arrow.
- Stop: 29210.70, below the divergence low (29221.00) minus a quarter of ATR (10.9 points). Risk: 48.66 points.
- Target: 29332.36, i.e. 1.5 times the risk from entry.
- Result: target hit at 07:45, after 13 bars: +1.48 R net of spread.
Example 3 · M1 · regular bearish, weak
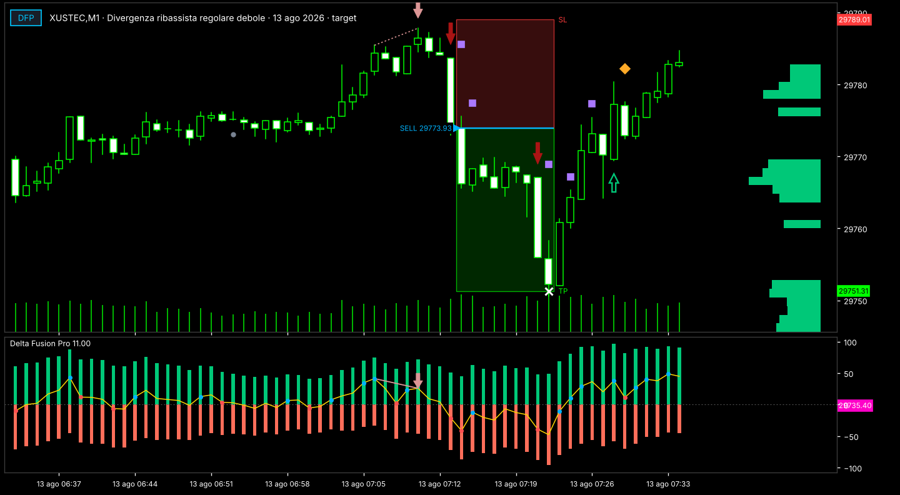
The divergence. At 07:06 price makes a high at 29785.45 with delta +41.4. Then, at 07:10, it goes higher, to 29787.82, but delta stops at +26.0: buying fades while price rises. The red arrow appears at 07:13, when the swing is confirmed.
The confirmations. This is the example with the most confirmations: a weak divergence becomes a solid trade when everything else points the same way.
- Sell imbalance at 07:13 (143 contracts sold vs 6): red dot on the Net Delta line.
- Strong bearish impulse at 07:13: price is already moving in the direction of the divergence. Divergence plus strong impulse together form a confluence.
- Net Delta crossing below zero at 07:13: the balance between buying and selling flips.
- VWAP at 29737.66, 36 points below price and beyond the target: the VWAP pulls price in the direction of the trade.
The trade.
- Entry: SELL at 29773.93 at 07:14 on 13 August, open of the bar after the arrow.
- Stop: 29789.01, above the divergence high (29787.82) plus the margin (1.2 points). Risk: 15.08 points.
- Target: 29751.31, i.e. 1.5 times the risk from entry.
- Result: target hit at 07:22, after 9 bars: +1.44 R net of spread.
Example 4 · M1 · regular bearish, weak
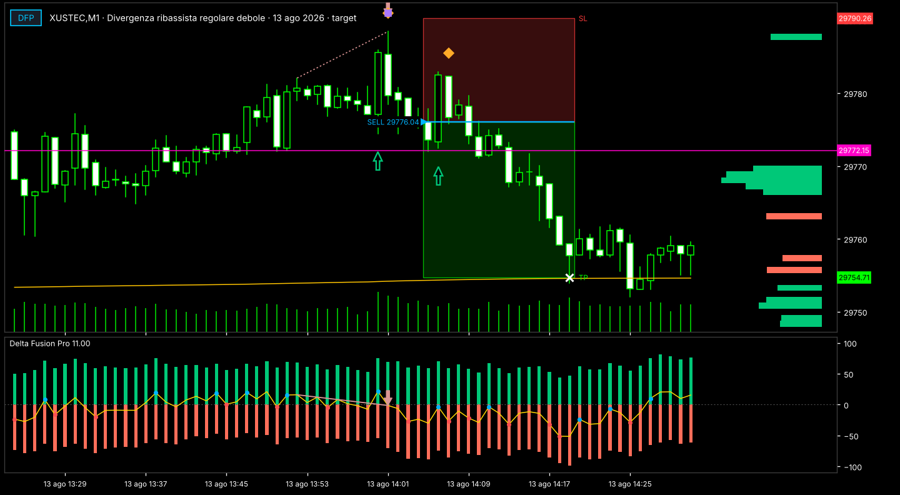
The divergence. At 13:52 price makes a high at 29782.08 with delta +16.0. Then, at 14:01, it goes higher, to 29788.46, but delta drops to −1.3: buying fades while price rises. The red arrow appears at 14:04, when the swing is confirmed.
The confirmations.
- Sell imbalance at 14:03 (134 contracts sold vs 13): red dot on the Net Delta line.
- Exhaustion at 14:01: the bar gives back most of the previous rise (orange diamond).
- VWAP at 29754.30, 22 points below price and beyond the target: the VWAP pulls price in the direction of the trade.
The trade.
- Entry: SELL at 29776.04 at 14:05 on 13 August, open of the bar after the arrow.
- Stop: 29790.26, above the divergence high (29788.46) plus the margin (1.8 points). Risk: 14.22 points.
- Target: 29754.71, i.e. 1.5 times the risk from entry.
- Result: target hit at 14:19, after 15 bars: +1.43 R net of spread.
Example 5 · M1 · hidden bullish, strong
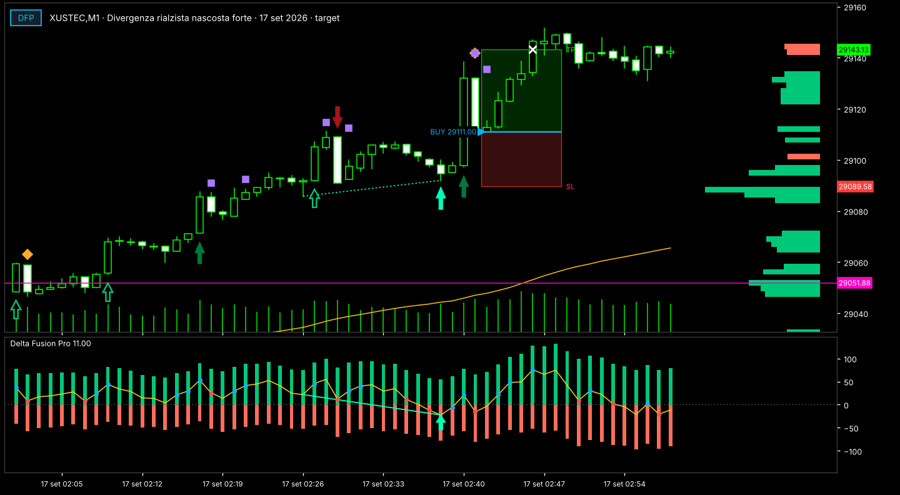
The divergence. At 02:26 price makes a low at 29085.77 with delta +21.8. Then, at 02:38, it makes a higher low, at 29091.99, while delta drops to −22.4: sellers push harder but price holds. That is the signal the uptrend can continue. The green arrow appears at 02:41, when the swing is confirmed.
The confirmations.
- Buy imbalance at 02:39 (89 contracts bought vs 20) and at 02:40 (153 vs 13): blue dots on the Net Delta line.
- Strong bullish impulse at 02:40: price is already moving in the direction of the divergence.
- VWAP at 29047.05: price is above it, on the same side as the trade.
The trade.
- Entry: BUY at 29111.00 at 02:42 on 17 September, open of the bar after the arrow.
- Stop: 29089.58, below the divergence low (29091.99) minus the margin (2.5 points). Risk: 21.42 points.
- Target: 29143.13, i.e. 1.5 times the risk from entry.
- Result: target hit at 02:46, after 5 bars: +1.46 R net of spread.
Example 6 · H1 · hidden bearish, medium
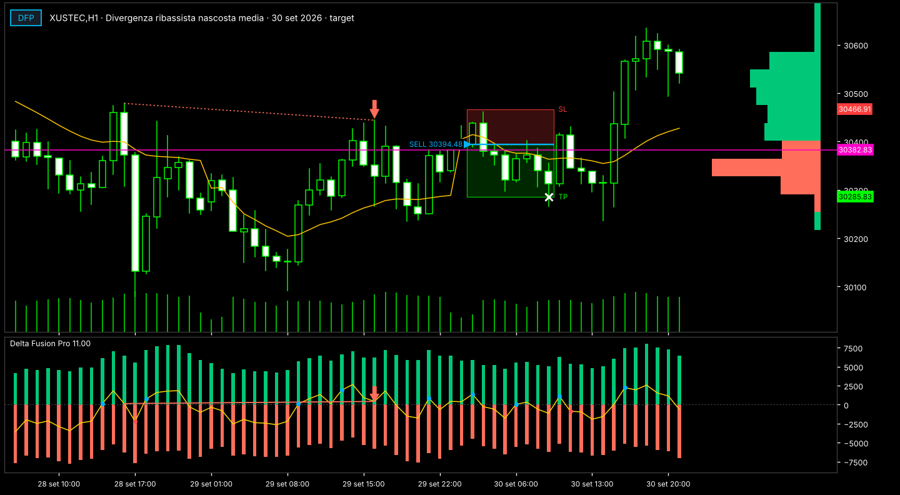
The divergence. On 28 September at 16:00 price makes a high at 30478.72 with delta +143. Then, on 29 September at 16:00, it makes a lower high, at 30443.89, while delta rises to +423: buyers push harder but price does not rise. That is the signal the downtrend can continue. The red arrow appears at 01:00 on 30 September, when the swing is confirmed.
The confirmations.
- VWAP at 30404.66: price is below it, on the same side as the trade.
The trade.
- Entry: SELL at 30394.48 at 02:00 on 30 September, open of the bar after the arrow.
- Stop: 30466.91, above the divergence high (30443.89) plus a quarter of ATR (22.7 points). Risk: 72.43 points.
- Target: 30285.83, i.e. 1.5 times the risk from entry.
- Result: target hit at 09:00, after 8 bars: +1.49 R net of spread.
Checklist before you enter
- Is there an arrow? Wait for it: it only appears once the swing is confirmed on closed bars, and from then on it never changes.
- How strong is it? Check the colour: a weak divergence needs more confirmations than a strong one.
- Does the flow confirm? Look for an imbalance in the direction of the trade, or Net Delta crossing zero, between the swing and the arrow.
- Does price confirm? An impulse, a strong impulse or an exhaustion in the same direction; a confluence gives you both readings at once.
- Does the context help? Check which side of the VWAP you are on, where the POC and the longest Delta Profile bars sit, and what the MTF row says.
- Does the stop make sense? Beyond the swing, plus the margin. If the stop is too far from the entry price, better to wait for a pullback towards the swing.
- Is it a quiet time of day? Around the Wall Street open and close, volatility changes suddenly: better to sit those minutes out.
MT5 or MT4?
Divergences work the same way on both platforms: same rules, same thresholds, same confirmations. What differs is what each platform lets the indicator read.
| MetaTrader 5 | MetaTrader 4 | |
|---|---|---|
| Delta measured on history | rebuilt from ticks at startup, up to 8 hours back | builds up from the moment the indicator is on the chart |
| Impulses and exhaustions | real time, plus rebuilt over the last 4 hours | real time |
| Divergences, imbalance, confluence, POC, Delta Profile, VWAP, MTF | identical | identical |
With a CFD broker, which does not publish executed trades, both versions use the estimated delta and behave the same way.
Disclaimer
The examples were selected from trades that reached their target, to show the method: not every divergence reaches its target, and past results, real or simulated, do not guarantee future ones. The examples are reconstructed from historical data and do not account for slippage or commissions other than the spread. On CFDs, delta is estimated from tick volume. This article is not financial advice: leveraged trading carries a high risk of loss. Try the method on a demo account before using it with real money.
Get Delta Fusion Pro 11.0: MetaTrader 5 version · MetaTrader 4 version




