
How to Prove Broker Spread Widening and Slippage With Timestamped Evidence in MetaTrader 5?

If you have ever looked at a fill and thought "my spread was much wider than normal", you already know the problem: without numbers, a broker dispute is your word against theirs. This post explains how to document broker spread widening and slippage in MetaTrader 5 so that you have real execution evidence, not guesses.
The problem: a feeling is not evidence
Spread widening around news, rollover or thin liquidity is normal for every broker. The real questions are different. How much wider was it compared to that symbol's usual behavior? Did it exceed what your broker advertises? Was your fill worse than the price you requested? Traders usually only notice this after the trade is closed, when the moment has already passed and the exact numbers are gone.
Prop firm traders face the same issue. If you are evaluating a firm's execution quality, a marketing page tells you little. You need your own measurements under real market conditions.
The manual way, and why it falls short
The usual manual approach is to take a chart screenshot, note the time, and write down the spread from the Market Watch window. Some traders also compare the order price in the trade history against the fill price after the fact.
This works for one or two trades, but it has clear weaknesses:
- You only capture what you happen to see, and only on the chart you have open.
- A screenshot has no baseline, so nobody can tell whether the spread was unusual for that symbol.
- Typed notes are easy to dispute and easy to get wrong.
- Slippage is easy to forget until the account statement arrives.
How ExecutionProof Auditor helps
ExecutionProof Auditor is a passive monitoring and evidence-logging utility for MetaTrader 5. It never places, modifies or closes a trade. It watches your configured symbol list and records what it sees. Based on its listing, it provides:
- Multi-symbol spread tracking. Your whole watchlist is sampled on a dedicated timer, so monitoring does not depend on which chart is open.
- Baseline comparison. Each symbol is compared with its own rolling average over a period you choose, so a spike is shown as a percentage above that symbol's normal level.
- Real versus advertised spread. You enter what your broker publishes for a symbol, and the tool flags moments when the live spread exceeds it by your chosen margin.
- Per-order slippage tracking. Each filled order is checked against its requested price, with a clear favorable or unfavorable sign.
- News-time detection. It cross-references MetaTrader's built-in Economic Calendar, so you can see whether a spike happened in a high-impact news window.
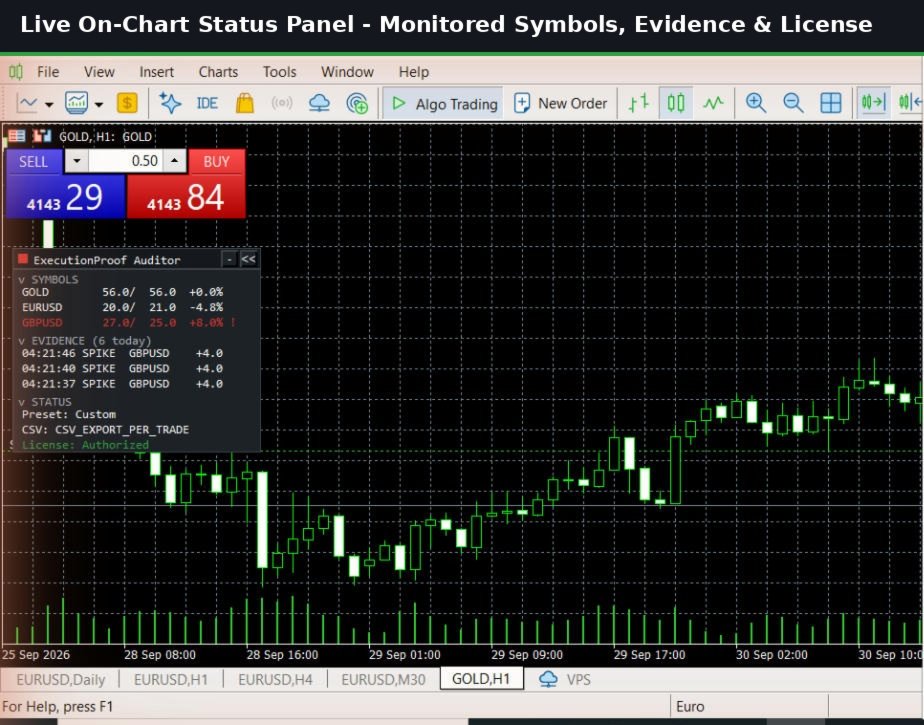
The on-chart status panel shows monitored symbols, their current and baseline spread, recent evidence entries and the current settings at a glance. You can drag it, fold it or expand it.
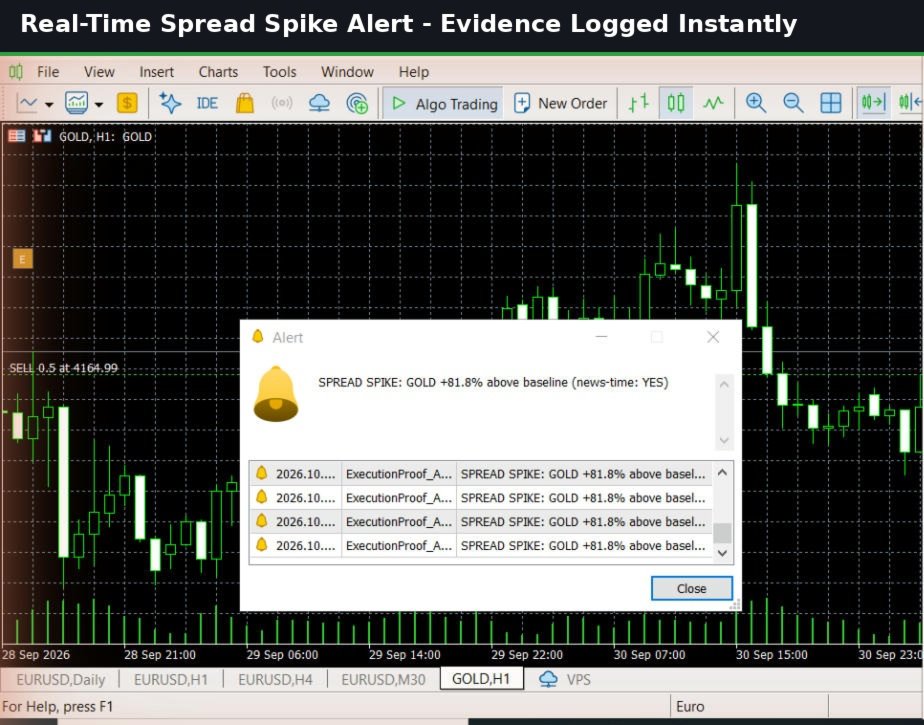
When a spike is detected, you can receive an alert (sound, visual or both) that states the symbol, the percentage above baseline and whether it happened during a news window.
Evidence you can hand over
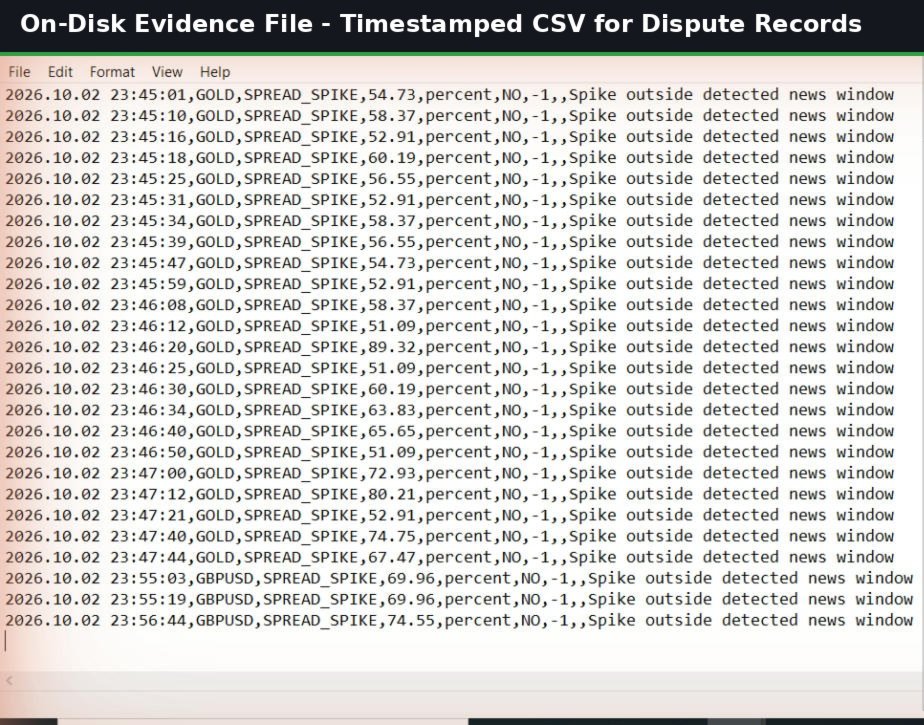
Every detected event is written to a dated CSV file on your own computer. Each row contains the timestamp, symbol, evidence type, magnitude, whether it was during news time, and a broker tag. Instead of saying "the spread felt wide", you can send a file with exact times and numbers. The tool also offers weekly and monthly summary reports for the overall trend.
All data stays on your machine, and nothing is transmitted anywhere. Settings include three presets (Scalper, Swing Trader and Prop Firm Strict) or full manual control, so you can match the thresholds to your own style.
A simple workflow
- Attach the tool to one chart and choose a preset or set your thresholds.
- Enter your broker's advertised spreads for the symbols you care about.
- Let it run through normal trading and news events.
- When you need proof, open the dated CSV or the summary report.
It is a monitoring and record-keeping tool. It does not predict anything and it does not change how your orders are executed. What it gives you is a documented, timestamped record of what your account actually experienced.
Where to find it
ExecutionProof Auditor is available in the MQL5 Market: ExecutionProof Auditor.




