
When you use statistical regimes to guide your market entry, you move away from guessing and toward a model that classifies price action into bull, bear, or sideways phases. The FJ Universe Quant Intelligence uses this logic to filter out noise, ensuring that your automated system only engages when the market demonstrates genuine directional conviction. By replacing manual intuition with a causal transition matrix, you can maintain a consistent approach that avoids the emotional pitfalls of over-trading in choppy conditions.
Situations where statistical regimes improve your results
- You find yourself entering trades during sideways markets only to be stopped out by whipsaw price action.
- You struggle to maintain discipline when your manual analysis is clouded by recent losses or market fatigue.
- You want to apply a single, consistent strategy across different instruments like stocks, metals, or crypto without constant manual recalculations.
- You need a systematic way to filter out low-probability trades that lack statistical edge.
The challenge of manual market assessment
Human traders often slip when trying to identify the current market state because our brains are wired to see patterns even where none exist. We might mistake a temporary pause in a trend for a reversal, leading to premature entries or missed opportunities. Manual routines are prone to emotional bias, where the fear of missing out or the frustration of a losing streak causes us to abandon our trading plan at the worst possible moment.
Automation approaches this by using a mathematical framework to define the market state. The FJ Universe Quant Intelligence utilizes a rolling log-return calculation to label the market as bull, bear, or sideways. Because this model is causal and learns only from completed bars, it prevents the common error of looking ahead at data that wasn't available when the trade decision was made. It acts as a radar, staying flat when the market is directionless and only activating when the probability of a move exceeds your set threshold.
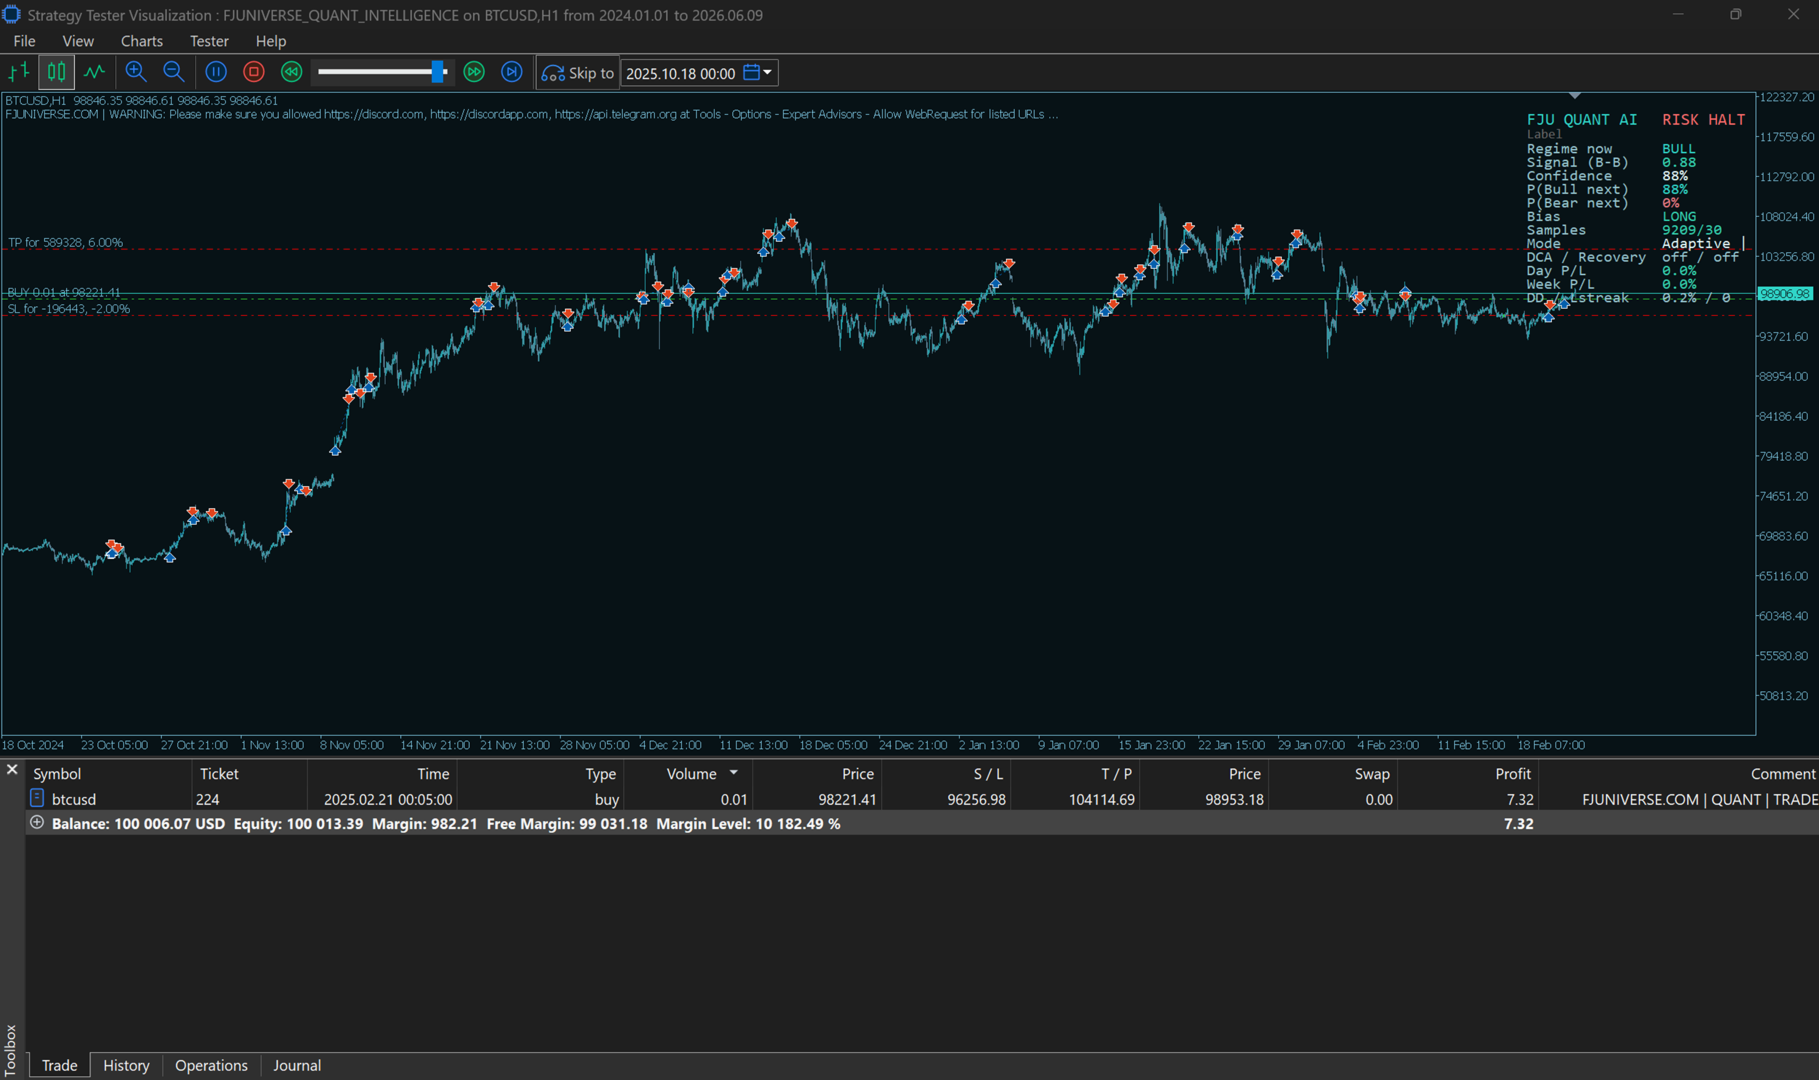
The dashboard of FJ Universe Quant Intelligence showing live regime status in MetaTrader 5
Moving from intuition to causal modeling
Understanding the transition matrix
The core of this approach is a 3x3 probability matrix that records how often one market regime follows another. Instead of relying on a fixed indicator that might fail as volatility shifts, the system continuously updates its expectations based on the most recent completed market data. This allows the strategy to adapt to the unique character of different assets, whether you are trading a trending currency pair or a volatile crypto asset.
The importance of the dead-zone
A significant portion of market time is spent in a sideways state where no clear trend exists. By configuring an entry dead-zone, you instruct your system to remain idle during these periods of low conviction. This is a practical way to protect your account from the 'death by a thousand cuts' that often occurs when traders attempt to force entries in choppy markets. It changes your focus from how many trades you can take to how many high-quality opportunities you can capture.
Practical benefits for your daily routine
- Reduced emotional strain: By letting the model handle regime classification, you remove the pressure of having to interpret complex charts yourself.
- Consistent risk control: The system applies percentage-based take-profit and stop-loss levels, ensuring that your risk parameters remain identical regardless of the instrument's price scale.
- Objective decision making: Decisions are gated by a strict probability edge, which keeps you from entering trades based on hope or temporary frustration.
- Automated recovery logic: The option to use Auto Lot Recovery allows the system to calculate necessary lot sizes to address previous losses, removing the need for manual math.
- Clear monitoring: The on-chart panel provides a real-time view of the current regime, giving you transparency into why the EA is acting or staying flat.
Steps to evaluate this approach this week
- Open the MetaTrader 5 Strategy Tester and select a trending symbol to begin your initial data collection.
- Set the EA to 'Visual Mode' to observe how the Markov regime classification changes as price action develops on the chart.
- Run a backtest using the 'CLASSIC' strategy mode to see how the model handles different market phases over a set period.
- Test the 'dead-zone' settings by adjusting the lookback window, noting how the frequency of trades changes in response.
- Configure your risk limits, such as daily or drawdown kill-switches, to ensure the system aligns with your personal risk tolerance.
- Deploy the system on a demo account for at least one week to observe its behavior in live market conditions without risking capital.
- Review the journal and the Discord notification logs at the end of the week to understand the rationale behind every closed position.
Tips for experienced users
- Start with the long-only setting on assets that have a historical upward bias, as this often simplifies the decision-making process.
- Use the adaptive threshold mode if you plan to trade across multiple asset classes, as it allows the EA to self-calibrate to different volatility levels.
- Always verify that your VPS is stable before running automated systems, as consistent connectivity is required for the Markov matrix to update accurately.
- Test the 'Smart' strategy modes if you decide to enable DCA, as these are designed to optimize your entry levels relative to existing positions.
- Keep your risk-per-trade conservative when first testing, as even the best models require a buffer to handle periods of unexpected market behavior.
Questions traders ask about Markov-based systems
How does the system know when the market regime has changed?
The system monitors the rolling log-return of price over a specific lookback window. When this return crosses your configured thresholds, the model classifies the market into a new regime, updating its internal probability matrix accordingly.
Can I use this on any time frame?
Yes, though it is tested most robustly as a daily, trend-persistence system. Because it acts on completed bars, it is highly sensitive to the quality and timeframe of the data you provide in the Strategy Tester.
What happens if the market enters a sideways phase while I have an open trade?
The EA can be configured to 'close on regime flip,' which exits the position the moment the directional edge fades. This helps prevent your profits from evaporating if the trend loses momentum.
Takeaways for your trading journey
- Automated regimes remove the guesswork from identifying trend direction.
- A causal model learns from past performance without the risk of look-ahead bias.
- Configurable dead-zones keep you out of the market during high-risk, choppy conditions.
- Consistent risk management parameters protect your capital across different types of instruments.
By shifting your focus toward these statistical methods, you can build a more disciplined and predictable routine. If you have any observations from your own testing or questions about how these regimes handle specific market events, please share your thoughts below.
For more details on the logic behind this approach, you can visit the FJUNIVERSE seller page on MQL5 page.
Related reading on this blog
- How to trade with a Markov regime switching model in MetaTrader 5
- How to maintain trading consistency using automated money management
- How to maintain trading consistency when manual analysis fails
About FJUNIVERSE: We build and run automated strategies for MetaTrader 5 and share what we learn at FJUNIVERSE.COM. Every product mentioned above is listed on our MQL5 seller page. Trading involves risk. Nothing here is investment advice, and past results describe the past only.


