
Paul H. Levine and MIDAS: The Physicist Who Anchored Price to Volume

Many traders use anchored VWAP without knowing the man who turned it into a complete method for reading markets. This article is a tribute to Paul H. Levine, PhD, the creator of the MIDAS method, and to the simple, generous idea he left behind.
From Wall Street runner to theoretical physicist
Paul H. Levine was born in New York City on 27 September 1935 and grew up in upstate New York. He first became interested in technical analysis as a high school student, when he worked as a "runner" on Wall Street.
He graduated from MIT with a BS in Physics in 1956, then earned his PhD in theoretical physics at the California Institute of Technology in 1963. The title of his thesis was "Phase Space Formulation of the Quantum Many-Body Problem."
In 1965 he joined Astrophysics Research Corporation as Chief Scientist. In 1972 he and three colleagues founded Megatek Corporation in San Diego, California. He retired from Megatek in 1981 as its Chief Scientist and co-founder.
Markets never left his mind. In his own words, he "took a fresh look at the problem some thirty years ago" — that is, around the mid-1960s — and "stumbled upon what has now evolved into the Midas method." After retiring, he developed it further. By 1995 he was in his fourth year as a professional trader.
The birth of MIDAS (1995)
In 1995 Levine published a series of online articles called Introducing the MIDAS Method of Technical Analysis. MIDAS stands for Market Interpretation/Data Analysis System. From the first article he wrote:
"It is designed to focus attention on the dynamic interplay of support/resistance and accumulation/distribution which are the ultimate determinants of price behavior. Indeed, a Midas chart makes immediately visually apparent an unexpected degree of orderliness in what might otherwise seem to be a random or chaotic process."
Anchor the average to the turn
Levine asked a simple question: what is the average price at which a market has been bought since its psychology last changed? A trend reversal, he argued, marks a shift in why people are buying or selling. A meaningful average therefore has to start at that reversal, not at some arbitrary point in the past:
"Our 'message' is that instead of 'moving' averages, one should take fixed or 'anchored' averages, where the anchoring point is the point of trend reversal."
He summed it up in one sentence: "support will be found at the volume-weighted average price taken over an interval subsequent to a reversal in trend."
The formula
Levine used the mean price of each bar, P = (H + L) / 2. For a curve launched on bar j, its value on bar i is:
S/R(i, j) = (cumPV(i) − cumPV(j)) / (cumVol(i) − cumVol(j))
Here cumPV is the running total of P × V and cumVol is the running total of volume. For Windows on Wall Street he wrote it as:
CUM(.5*(H+L)*V*IF(CUM(1)>DAYS,1,0)) / CUM(V*IF(CUM(1)>DAYS,1,0))
A detail often forgotten is that Levine preferred to plot price against cumulative volume rather than time. On a volume axis, quiet periods are compressed and the curves look smooth instead of jerky.
Levine's two insights
In his own words, "the truly new insights provided by the Midas method are twofold":
- A hierarchy of support and resistance. He described "the heretofore unrecognized hierarchal structure of support/resistance levels and their a priori prediction in terms of the volume-weighted average price taken over an interval subsequent to a trend reversal point." Each reversal launches its own curve (S1, S2, S3…), and the same structure appears on short and long time scales alike.
- Guided trends. He also found that "there frequently exists a remarkable underlying structure which dominates or 'guides' the bull or bear move as it develops." To capture it he created the Topfinder (and its mirror image, the Bottomfinder), which he said he "discovered empirically."
The Topfinder/Bottomfinder (TB-F) has two parameters: the launch point, and a duration D measured in cumulative volume. D is fitted to the trend's pullbacks. The curve then predicts the cumulative volume at which an accelerated move should end — its "burnout" point. He compared it to a rocket loaded with a fixed amount of fuel. The volume, he stressed, is "the firm prediction"; the price at the top is "only an extrapolated estimate." True TB-F setups are rare, and he always reminded readers that "the market is in the final analysis inherently unpredictable."
Why banks and institutions watch VWAP
Levine built MIDAS on the volume-weighted average price, and VWAP is one of the most widely used benchmarks in professional trading:
- An execution benchmark. When a fund or bank buys or sells a large position, its trading desk is often judged on whether the average fill beat VWAP. Buying below VWAP, or selling above it, means the order was handled well.
- VWAP algorithms. Large orders are often split into many small pieces and spread through the session in line with typical volume, with the aim of matching VWAP. This keeps the order from moving the price against itself.
- A fair-value reference. VWAP shows the average price everyone actually paid, weighted by how much they traded. Price above it means buyers are in control for that period; price below it means sellers are.
- Anchored VWAP from key events. Many professional traders anchor VWAP to earnings, gaps, or major highs and lows to see the average cost of everyone who has traded since that event. That is Levine's idea of anchoring at a change in market psychology.
Because so much institutional money is measured against these averages, they often act as real support and resistance. MIDAS gives retail traders the same view, anchored where it matters most: at the turns.
A generous legacy
When readers asked why he gave this away for free, Levine replied:
"I have always felt that if MIDAS has any practical value, ample rewards would come from the market itself (and they have) far in excess of anything that could be made from such commercialization of the method… It is my hope that the articles will stimulate research along these new lines and that the same spirit of openness will prevail in sharing the results."
That hope came true. David G. Hawkins and Andrew Coles, PhD, carried the work forward in a series of articles and in the book MIDAS Technical Analysis: A VWAP Approach to Trading and Investing in Today's Markets (Bloomberg Press, 2011).
- Coles published the first studies applying MIDAS curves to intraday charts for day trading, and later developed the MIDAS Displacement Channel.
- Hawkins wrote the book's biographical sketch of Levine and contributed work on calibrated curves and very long-term charts.
- Bob English added further curves and indicators, including MIDAS Average and Delta curves and Reverse MIDAS.
Through all of it, the standard support/resistance curve and the Topfinder/Bottomfinder remain Levine's own.
MIDAS in practice: the CGE Trading Suite
When I built the CGE Trading Suite for MetaTrader 5, I wanted MIDAS in it because I believe it is one of the most underrated ideas in technical analysis. The Suite's MIDAS module is my own practical implementation of Levine's principles, not a reproduction of his original charts:
- Automatic launch points. Curves are anchored at confirmed swing lows (support) and swing highs (resistance). The pivot lookback is adjustable and defaults to 2 bars on each side.
- Support and resistance curves. Instead of Levine's (H + L) / 2, support curves are volume-weighted from the bar lows and resistance curves from the bar highs, which suits candlestick charts. Hawkins discusses this choice in the book. Up to 10 curves per side can be shown.
- Volume source. By default the module uses tick volume, which makes it usable on forex and CFDs. An optional setting switches to real exchange volume where the broker provides it.
- Topfinder/Bottomfinder. The module looks for a pullback in the trend and fits D to it automatically with a numerical search, instead of fitting it by eye. It shows how much of the projected volume has been used as a "% complete" reading, and it draws a projected burnout point based on the recent average volume per bar. Like Levine's own projections, that point is an estimate, not a promise.
- Only levels that still hold. A curve is removed once a completed bar closes through it or price trades beyond the swing it was launched from. A TB-F curve is removed once a completed bar closes through it. The chart shows only the levels the market is still respecting.
The aim was never to improve on Levine's thinking. It was to make his curves easy to use on every symbol and timeframe, so traders can focus on reading the story volume is telling.
Two examples from live charts
Example 1: NZDUSD, M15 (14 to 15 October 2026)
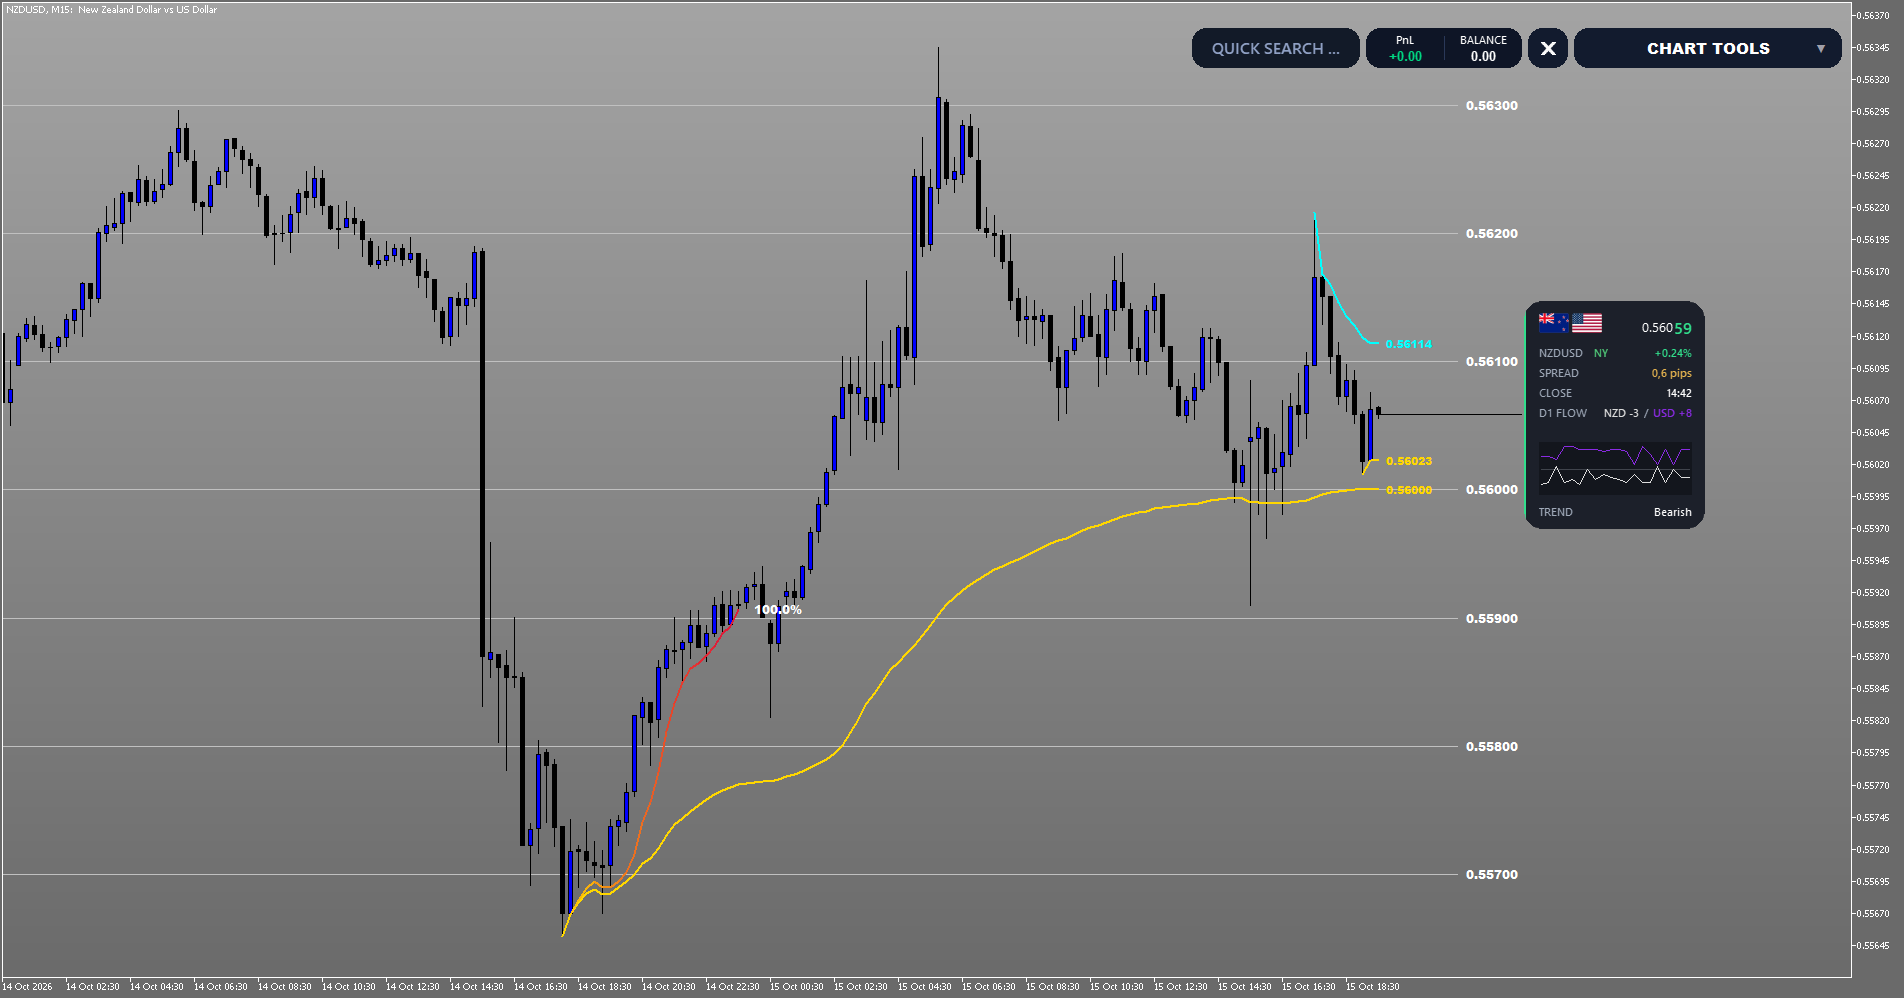
The main support curve (yellow colour) was launched from the swing low on the afternoon of 14 October, near 0.5566. As the rally developed, price pulled back several times and the curve kept rising underneath it. It is now at 0.56000, still below price, so the level is still holding.
The Topfinder (the red curve) was fitted to the same low and shows 100.0% complete at around 0.5590. That is where the first leg of the rally paused and pulled back overnight before the trend continued. This is how Levine meant the Topfinder/Bottomfinder to be read: it tells you when a move has used up its projected volume, not where price must reverse.
On the other side, an aqua coloured resistance curve was launched from the spike high on the afternoon of 15 October. Price has stayed below it since. Price now sits between the resistance curve at 0.56114 and the support curves at 0.56023 and 0.56000, which gives clear, volume-based levels to plan around.
Example 2: Gold (XAUUSD), Daily

Gold topped near 4700 in late August. The aqua resistance curves launched from the top area, now at 4352.88 and 4241.14, have capped every rally since then. Each bounce in September and early October turned lower before reaching them.
The Bottomfinder fitted to the decline is 81.4% complete. Based on the recent average volume per bar, the Suite projects its burnout around 24 October 2026, with a projected level of 3976.97. Like Levine's own projections, this is an estimate, not a promise. It tells you the selling pressure from this decline has not yet used up its projected volume, so the resistance curves remain the levels to respect until it does.
Why MIDAS still matters
Indicators come and go, but Levine's insight lasts: an average only means something when it starts where the market changed its mind. More than three decades after he shared MIDAS freely with the trading community, his curves are still drawn on charts around the world.
Thank you, Dr. Levine.
References
- Paul Levine – The MIDAS Method of Technical Analysis (1995, PDF)
- Coles & Hawkins – MIDAS Technical Analysis (2011)
- CGE Trading Suite


