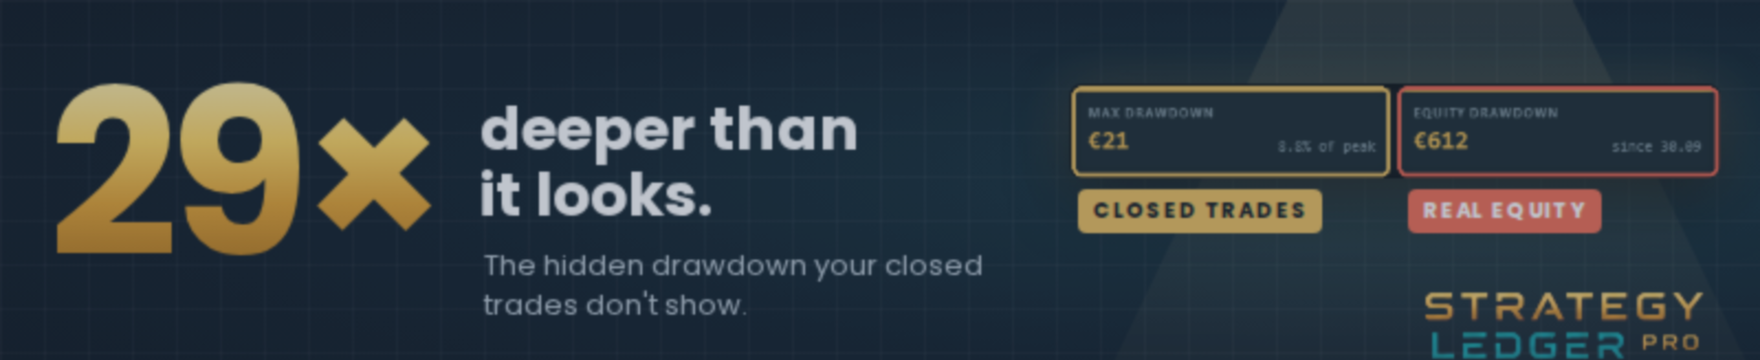
29 Times Deeper Than It Looks: The Hidden Drawdown Your Closed Trades Don't Show

Most trading statistics are built from closed trades. Win rate, profit factor, maximum drawdown, Monte Carlo: all of them look only at positions that have already been closed. That works for an EA that cuts its losers quickly. For an EA that keeps its losers open, it hides most of the risk.
Grids, averaging systems and EAs with very wide stops all do this. They close winners fast and let losers wait. Their closed record looks calm, sometimes spectacular, while the account carries a loss that never appears in the statistics until the day it is closed. Here is a real example, why the usual numbers miss it, and how Strategy Ledger Pro brings it to light.
A real example: a near-perfect record on paper
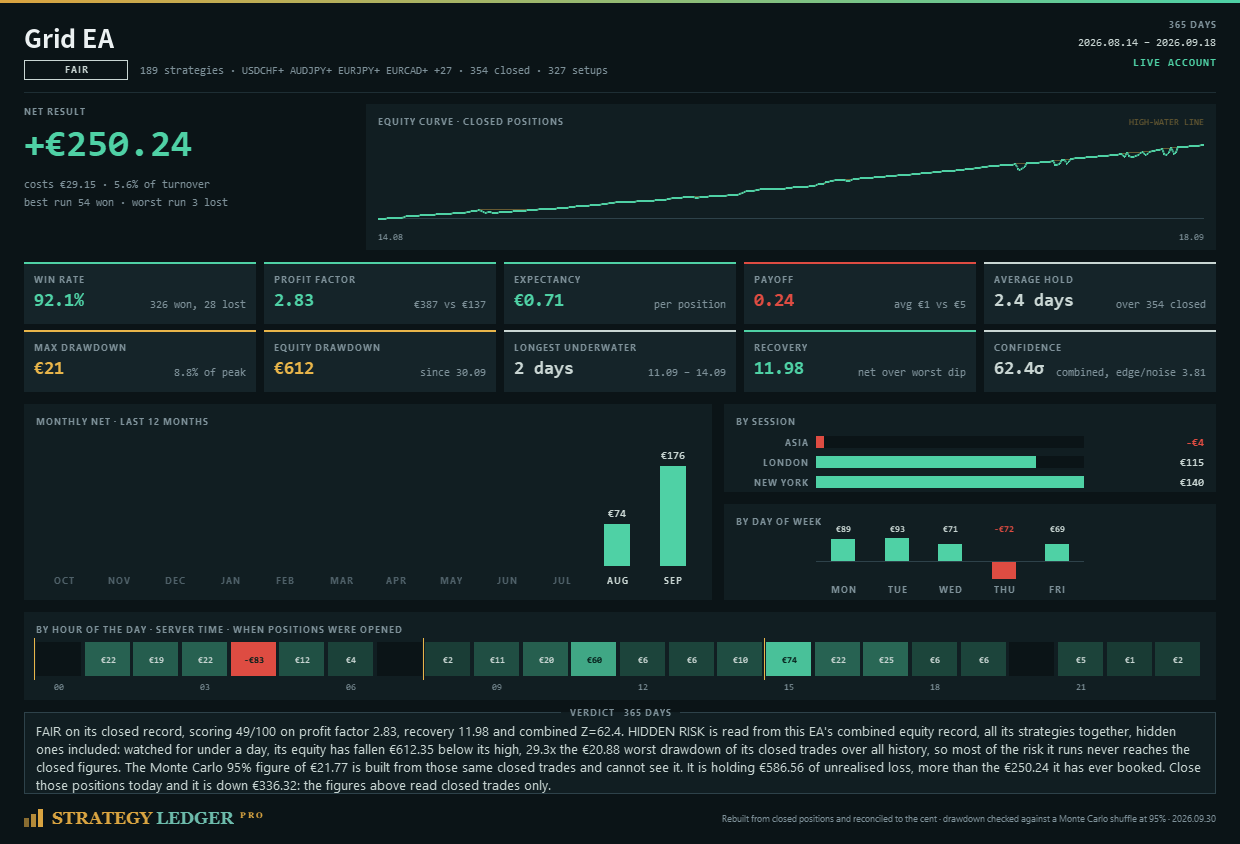
The card in the image above is a grid EA running on one of my live accounts, over 14 August to 18 September 2026. On its closed record it looks excellent: 354 closed positions, a win rate of 92.1%, a profit factor of 2.83, a recovery factor of 11.98 and a net result of +€250.24. Its worst drawdown on closed trades was only €20.88.
Now look at what the account was actually carrying at the same moment:
| What closed trades show | What the account actually carries | |
|---|---|---|
| Worst drawdown | €20.88 | €612.35 below its high: 29.3 times deeper |
| Result | +€250.24 booked | −€336.32 if everything were closed today |
| Open loss | not counted | €586.56, more than everything it has ever booked |
| Monte Carlo 95% drawdown | €21.77 | built from closed trades, so blind to the open loss too |
The warning sign is on the card as well: a payoff of 0.24, shown in red. The average win is €1 and the average loss is €5. A very high win rate with a very low payoff often means the losers are being held, not cut.
Why the usual numbers miss it
A closed-trade drawdown only moves when a trade closes. While a losing position stays open, the balance does not change, so the drawdown does not either. The equity falls, but most statistics never look at equity.
Win rate is flattered in the same way. The EA closes many small winners and keeps its few large losers open, so the losers are simply not counted yet.
Monte Carlo does not help here. It reshuffles the order of closed trades to estimate how bad a drawdown could get. Every trade it reshuffles is a closed one, so it inherits exactly the same blind spot. A Monte Carlo figure of €21.77 next to a real equity drawdown of €612.35 is not a contradiction: it answers a different question.
How Strategy Ledger Pro brings hidden risk to light
Strategy Ledger Pro does not stop at the closed record. For every EA, strategy, symbol and magic number, it sets what was closed against what is being carried, and says plainly when the two disagree.
- Two drawdowns, side by side. MAX DRAWDOWN (closed trades) and EQUITY DRAWDOWN (real equity) sit next to each other on every board and every card, so a gap like €21 against €612 is visible at a glance.
- A HIDDEN RISK flag. When an EA's equity drawdown reaches three times its worst closed drawdown or more, it is flagged. Here the multiple was 29.3.
- A verdict in plain words. The card does not just print numbers; it explains them: how far the equity has fallen, how many times deeper than the closed record, how much loss is still open, and what the result would be if everything were closed today.
- The open loss set against everything booked. €586.56 open against €250.24 booked tells you, in one line, that the profit on paper is not yet profit.
- Honest labels. The Monte Carlo figure is marked as built from closed trades, so it is never mistaken for a measure of the open risk.
- Warning colours where they matter. The payoff tile turns red when wins are much smaller than losses, the classic signature of losers being held.
- Setups, not just positions. A grid's rungs opened together are counted as one setup (here 354 positions, 327 setups), so its statistics are not inflated by the grid itself.
- Hidden strategies included. An EA's equity record covers all its strategies, even the ones you hid from view, so nothing can hide behind a filter.
One honest limit: MT5 keeps no history of floating equity per EA. Strategy Ledger Pro records it while the panel runs, from the moment it is attached. The €612.35 in this example was captured in under a day of watching, so the real historical figure may have been deeper still. Attach it early and let it run. The closed-trade figures, by contrast, are rebuilt from your full history and reconciled to the cent.
The panel is read-only: it cannot place, modify or close trades, and nothing leaves your terminal.
A five-point check for your own EAs
- Compare equity drawdown with closed drawdown. Three times or more means most of the risk is invisible in the closed record.
- Compare the open loss with everything booked. When an EA's floating loss is larger than its total booked profit, closing it today would turn it negative.
- Read win rate together with payoff. A win rate above 80% with a payoff below 0.5 deserves a closer look at how losers are handled.
- Look at how long losers are held. Losers held much longer than winners are a sign the EA is waiting rather than cutting.
- Measure equity per EA, not per account. On an account running several EAs, one EA's floating loss can hide behind another's profit.
Try it on your own account
A strong closed record is not the same as a safe account. Before trusting an EA with more money, look at what it is carrying, not only at what it has closed.