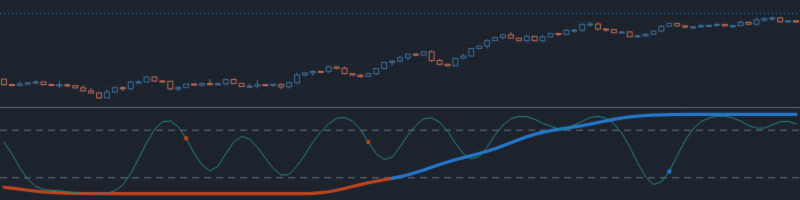

AW Prime Oscillator EA trades on the signals of the AW Prime Oscillator indicator: the fast line of the oscillator crosses the overbought and oversold levels, and the slow line sets the current trend.
The indicator is built into the EA: it does not need to be attached to the chart, and the oscillator window is shown in the strategy tester in Visualization mode. The signal is read from the closed bar once per bar, and the order opens on the next bar. TakeProfit is virtual and is measured from the breakeven of the side's entire basket. An averaging grid can optionally be added to the first order.
The EA is not multi-currency: it trades the symbol of the chart it is attached to. To trade several symbols, the EA is attached to each chart separately. Section 9 explains how to choose Orders Magic number.
Product links: AW Prime Oscillator EA for MT5, AW Prime Oscillator EA for MT4 and AW Prime Oscillator indicator for MT5. The EA does not require a separate purchase of the indicator, since it is built in.
The article contains the following sections:
- How the EA trades
- Testing in the strategy tester
- TakeProfit and StopLoss
- The averaging grid and overlap of the outermost orders
- Filters: working hours, spread, higher timeframe trend
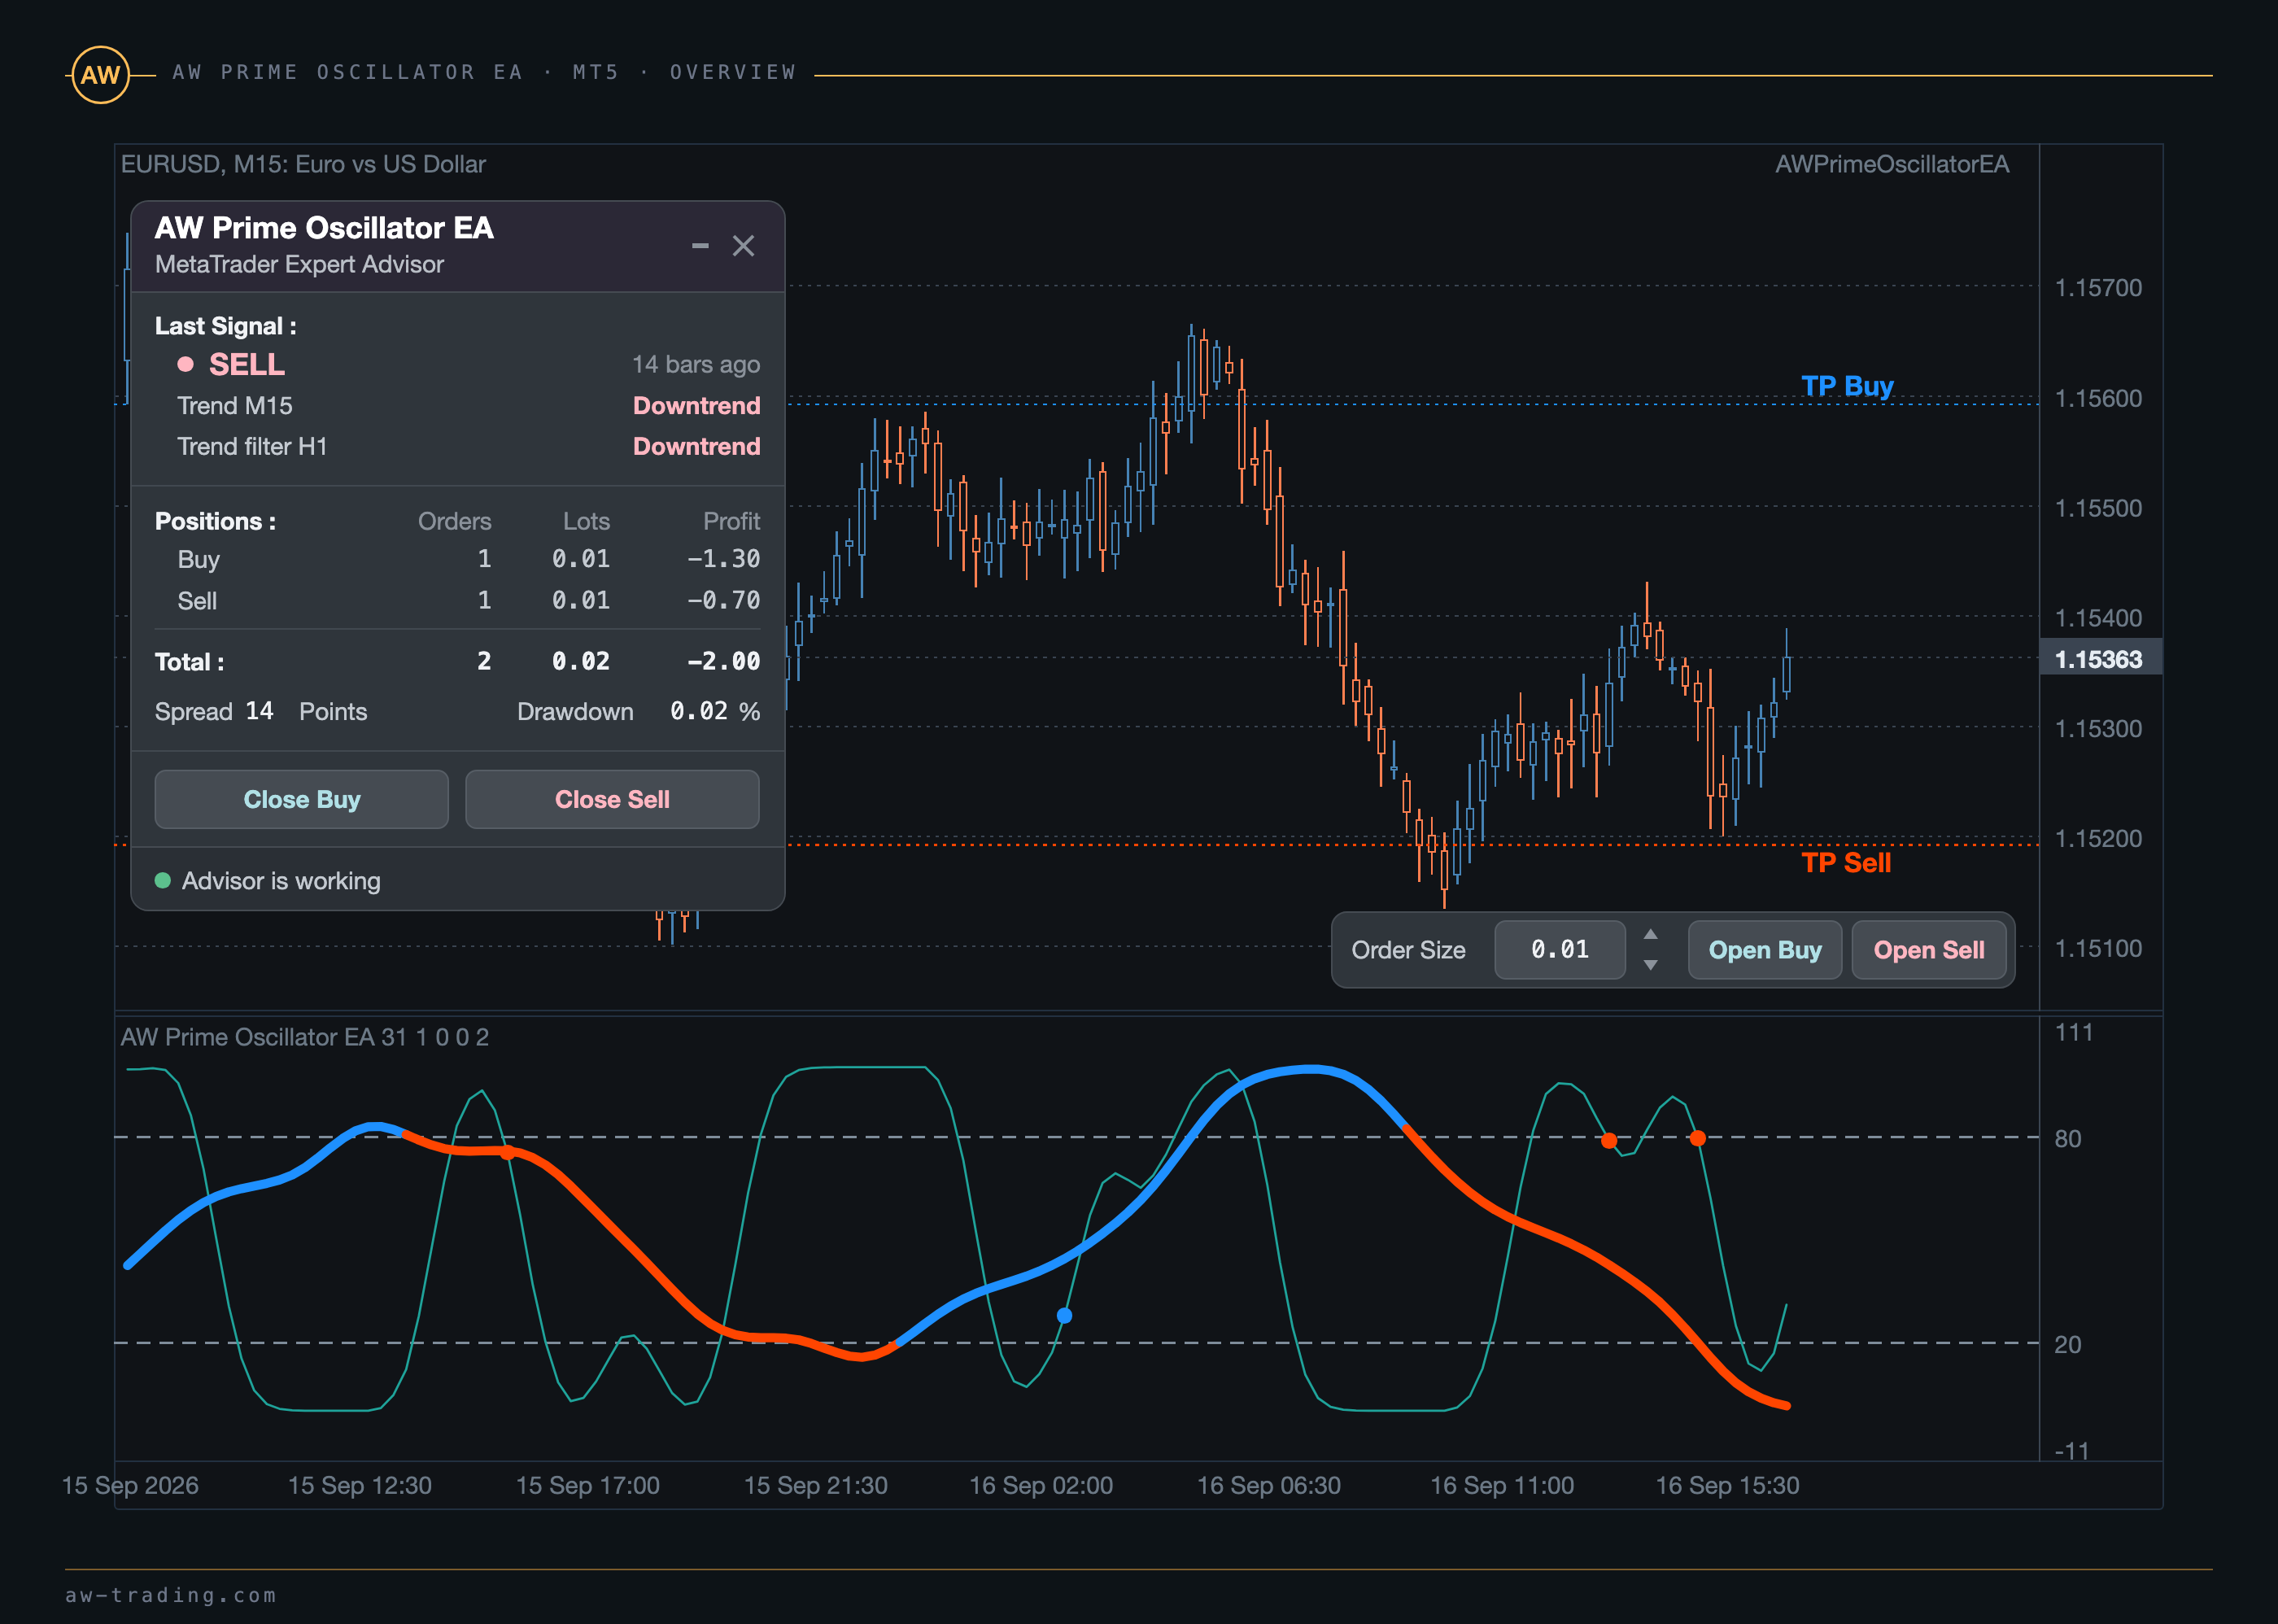
- The EA panel
- Notifications
- Input settings
- Identifiers and running on several charts
1. How the EA trades
The AW Prime Oscillator indicator consists of two lines in a separate window below the chart. The fast line gives entry points, the slow line shows the trend. The EA calculates both lines with the same math as the indicator itself, so the EA and the indicator give the same signals on the same chart.
Levels. The High level of indicator and Low level of indicator variables set the upper and lower levels of the window. The levels are used both for signals and for determining the trend.
Fast line signal. A buy signal is the fast line crossing the lower level upward. A sell signal is the fast line crossing the upper level downward. The signal belongs to the bar on which the crossing occurred and is evaluated at the close of that bar.
Slow line trend. The trend is set by the last level crossing of the slow line: crossing either level upward turns the trend up, crossing downward turns it down. The slow line is drawn in the color of the trend, and while the trend is not yet defined, the line is grey.
Signal mode. The Signals strategy variable in the PRIME OSCILLATOR SETTINGS section selects one of two modes.
| Mode | When an order opens |
|---|---|
| Fast oscillator signal | On every level crossing of the fast line, regardless of the trend |
| Signal by current trend | Only when the signal agrees with the slow line trend on the same bar: buys in an uptrend, sells in a downtrend |
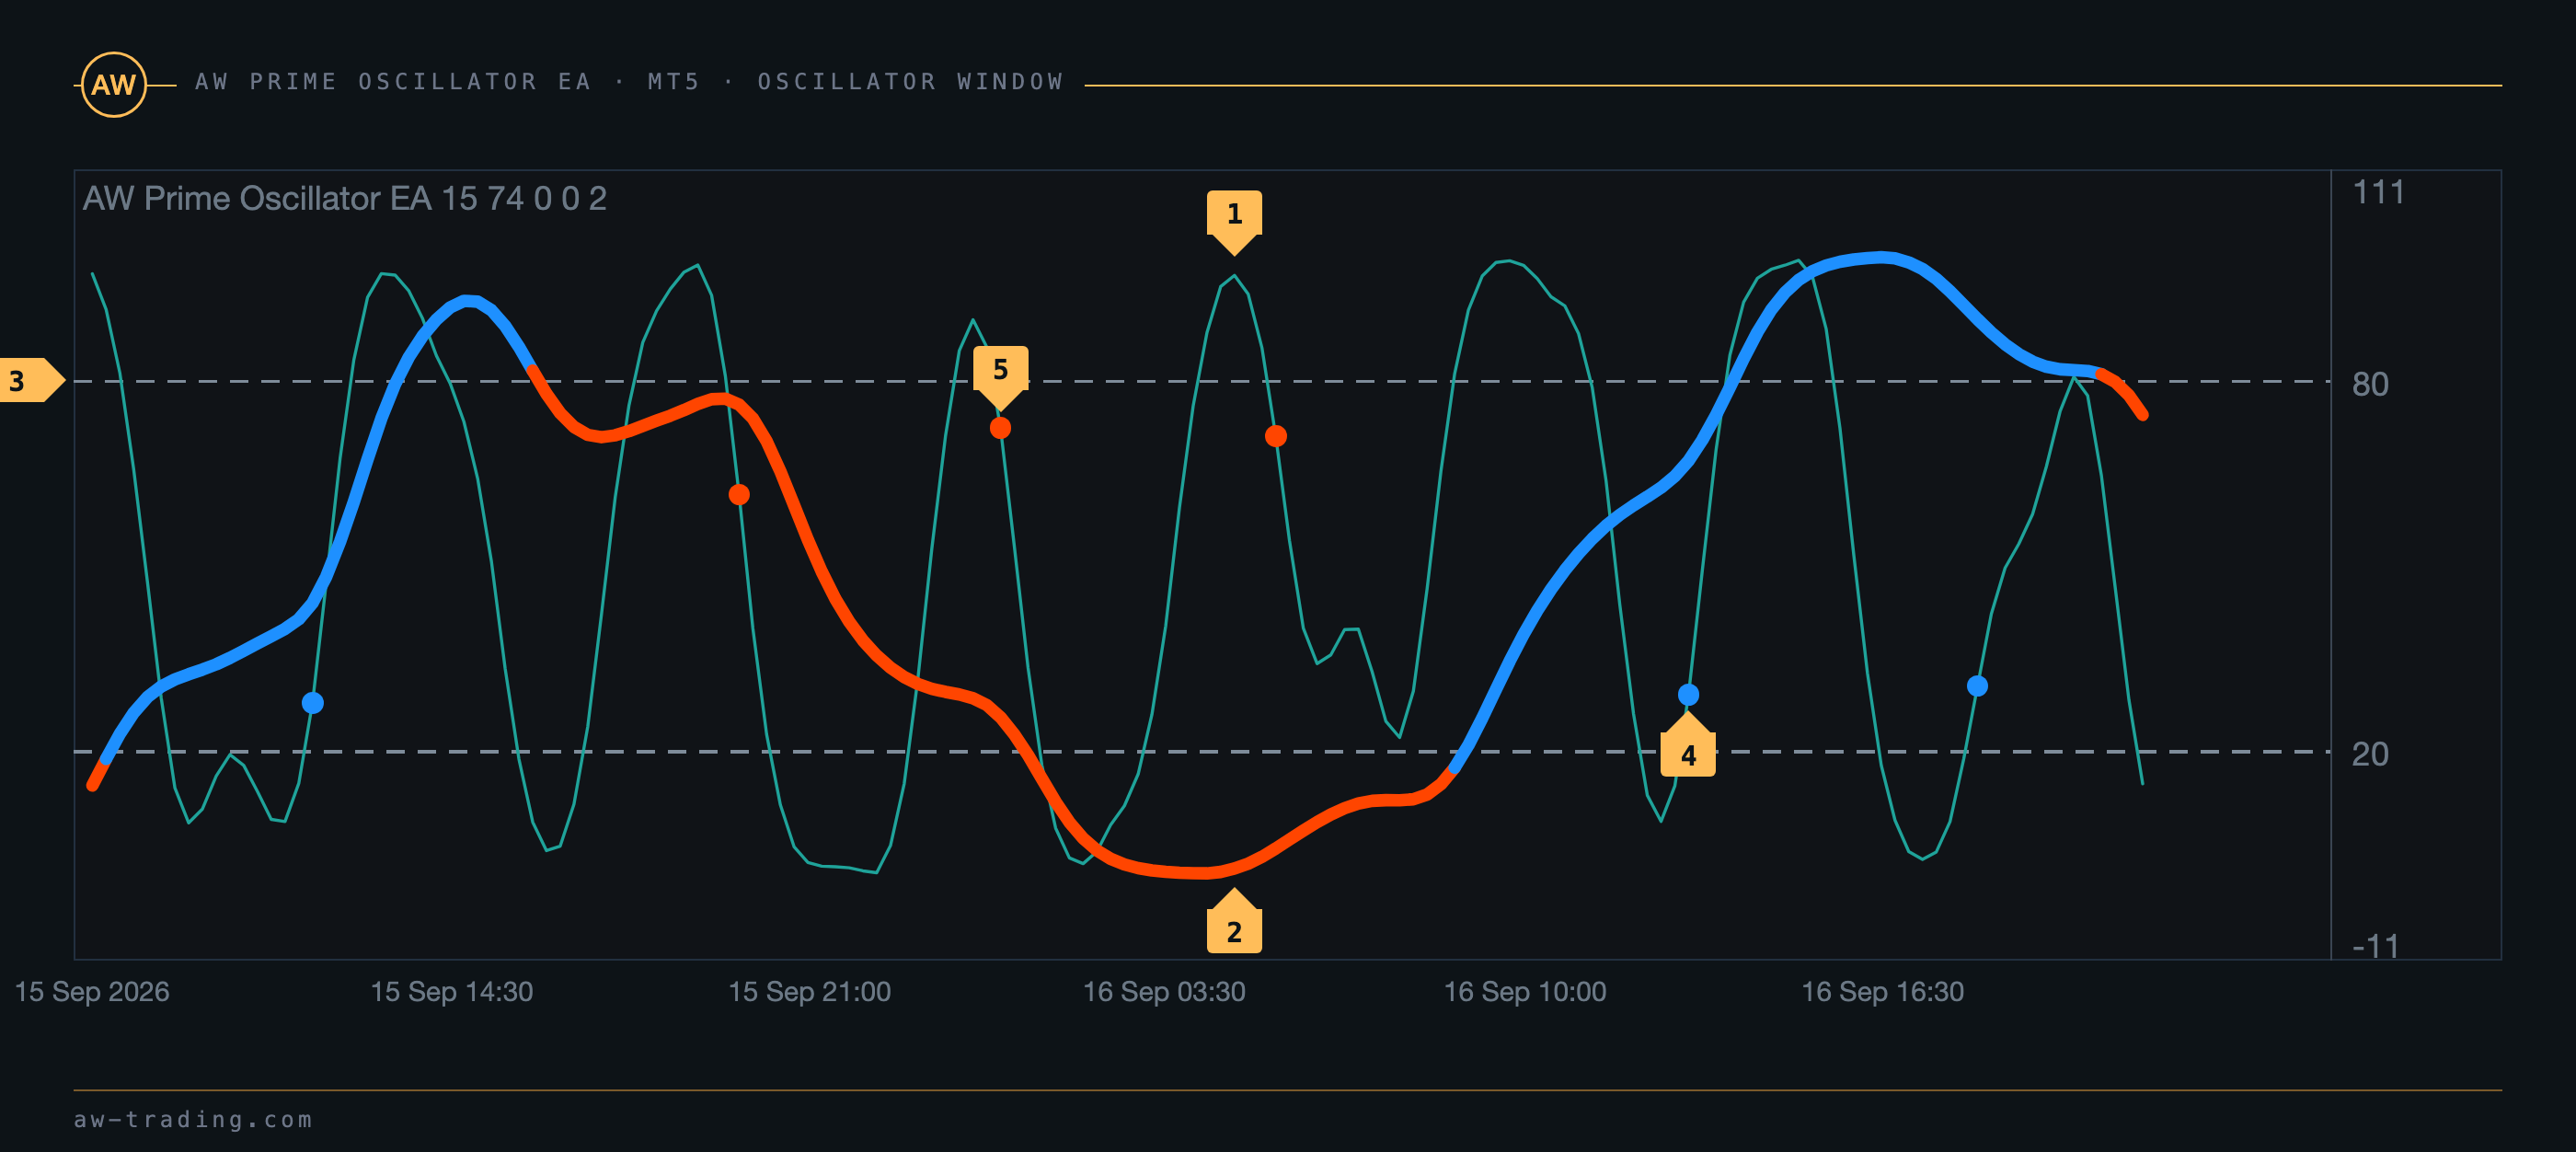
| No. | What is in the oscillator window |
|---|---|
| 1 | The fast line. Its crossings of the levels are the signals. |
| 2 | The slow line, drawn in the color of the trend: blue in an uptrend, orange in a downtrend. |
| 3 | The High level and Low level lines. |
| 4 | A buy signal dot: the fast line has risen from below the lower level. |
| 5 | A sell signal dot: the fast line has crossed the upper level downward. |
Entry. The EA reads the signal once per new bar, from the bar that has just closed. If there are no orders in the direction of the signal, the first order opens. All entry conditions are listed below.
Step 1 - At the close of a bar a signal arrives in a direction allowed by the Allow to open OP_BUY orders or Allow to open OP_SELL orders variables.
Step 2 - The EA has no orders in this direction, and the opposite side is empty. With Can EA work in both directions in same time enabled, the opposite side is not checked.
Step 3 - The entry passes the filters: working hours, maximum spread, higher timeframe trend, one order per bar. The filters are described in section 5.
Step 4 - A market order opens with the Size of the order volume. With AutoLot enabled, the volume is calculated from the balance, see section 8.
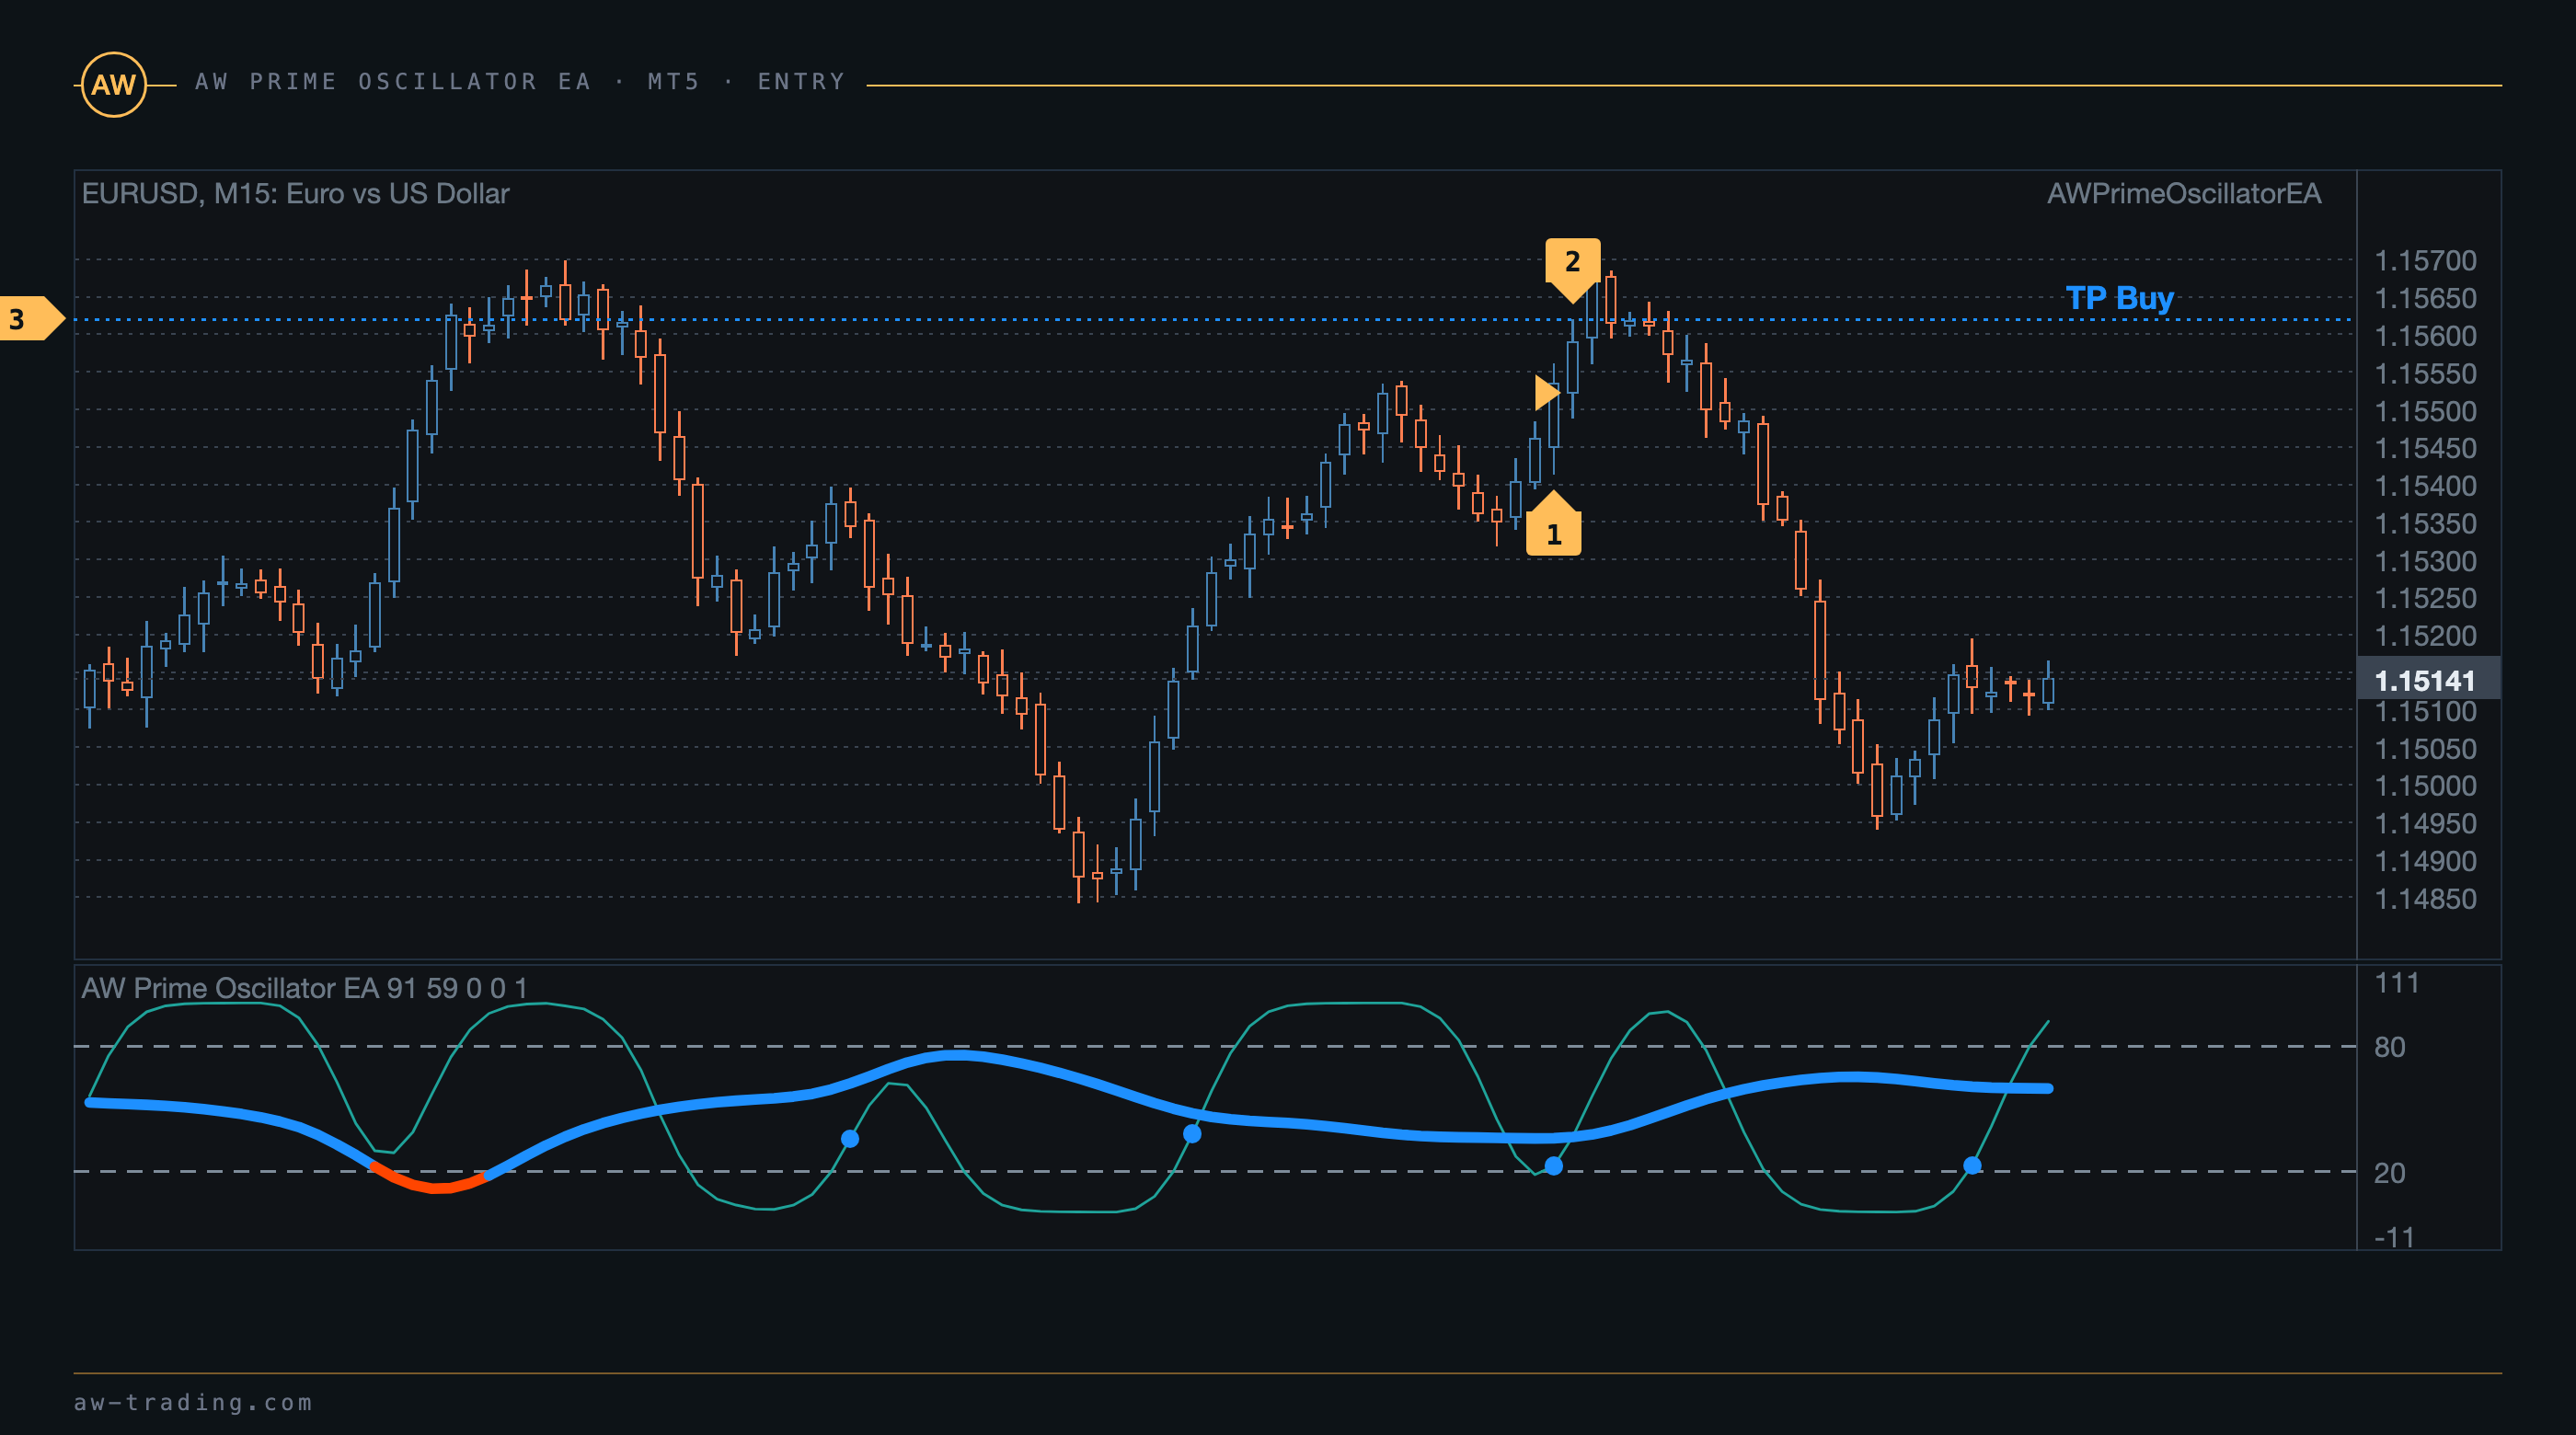
| No. | On the chart |
|---|---|
| 1 | The signal bar. At its close the fast line has crossed the level. |
| 2 | The entry bar. The order opens on the first tick of the next bar. |
| 3 | The TP Buy line: the side breakeven plus TakeProfit in Points. The line moves together with the basket. |
Why did the order not open right after the signal on the indicator? An indicator attached to the chart manually draws an arrow on the bar that is still forming and may remove it if the crossing is undone within the bar. The EA waits for the bar to close and works only with a confirmed signal, so the entry always comes on the next bar.
What does the Last Signal line on the panel show? The direction of the last signal on the chart and its age in bars. At startup the EA finds the last signal in the history, up to 3000 bars back.
2. Testing in the strategy tester
The EA works in the tester on any symbol and timeframe. The indicator is built in and does not need to be installed separately. In Visualization mode the tester shows the oscillator window, the TakeProfit lines, the close marks and the panel, and the panel buttons can open and close orders during the test.
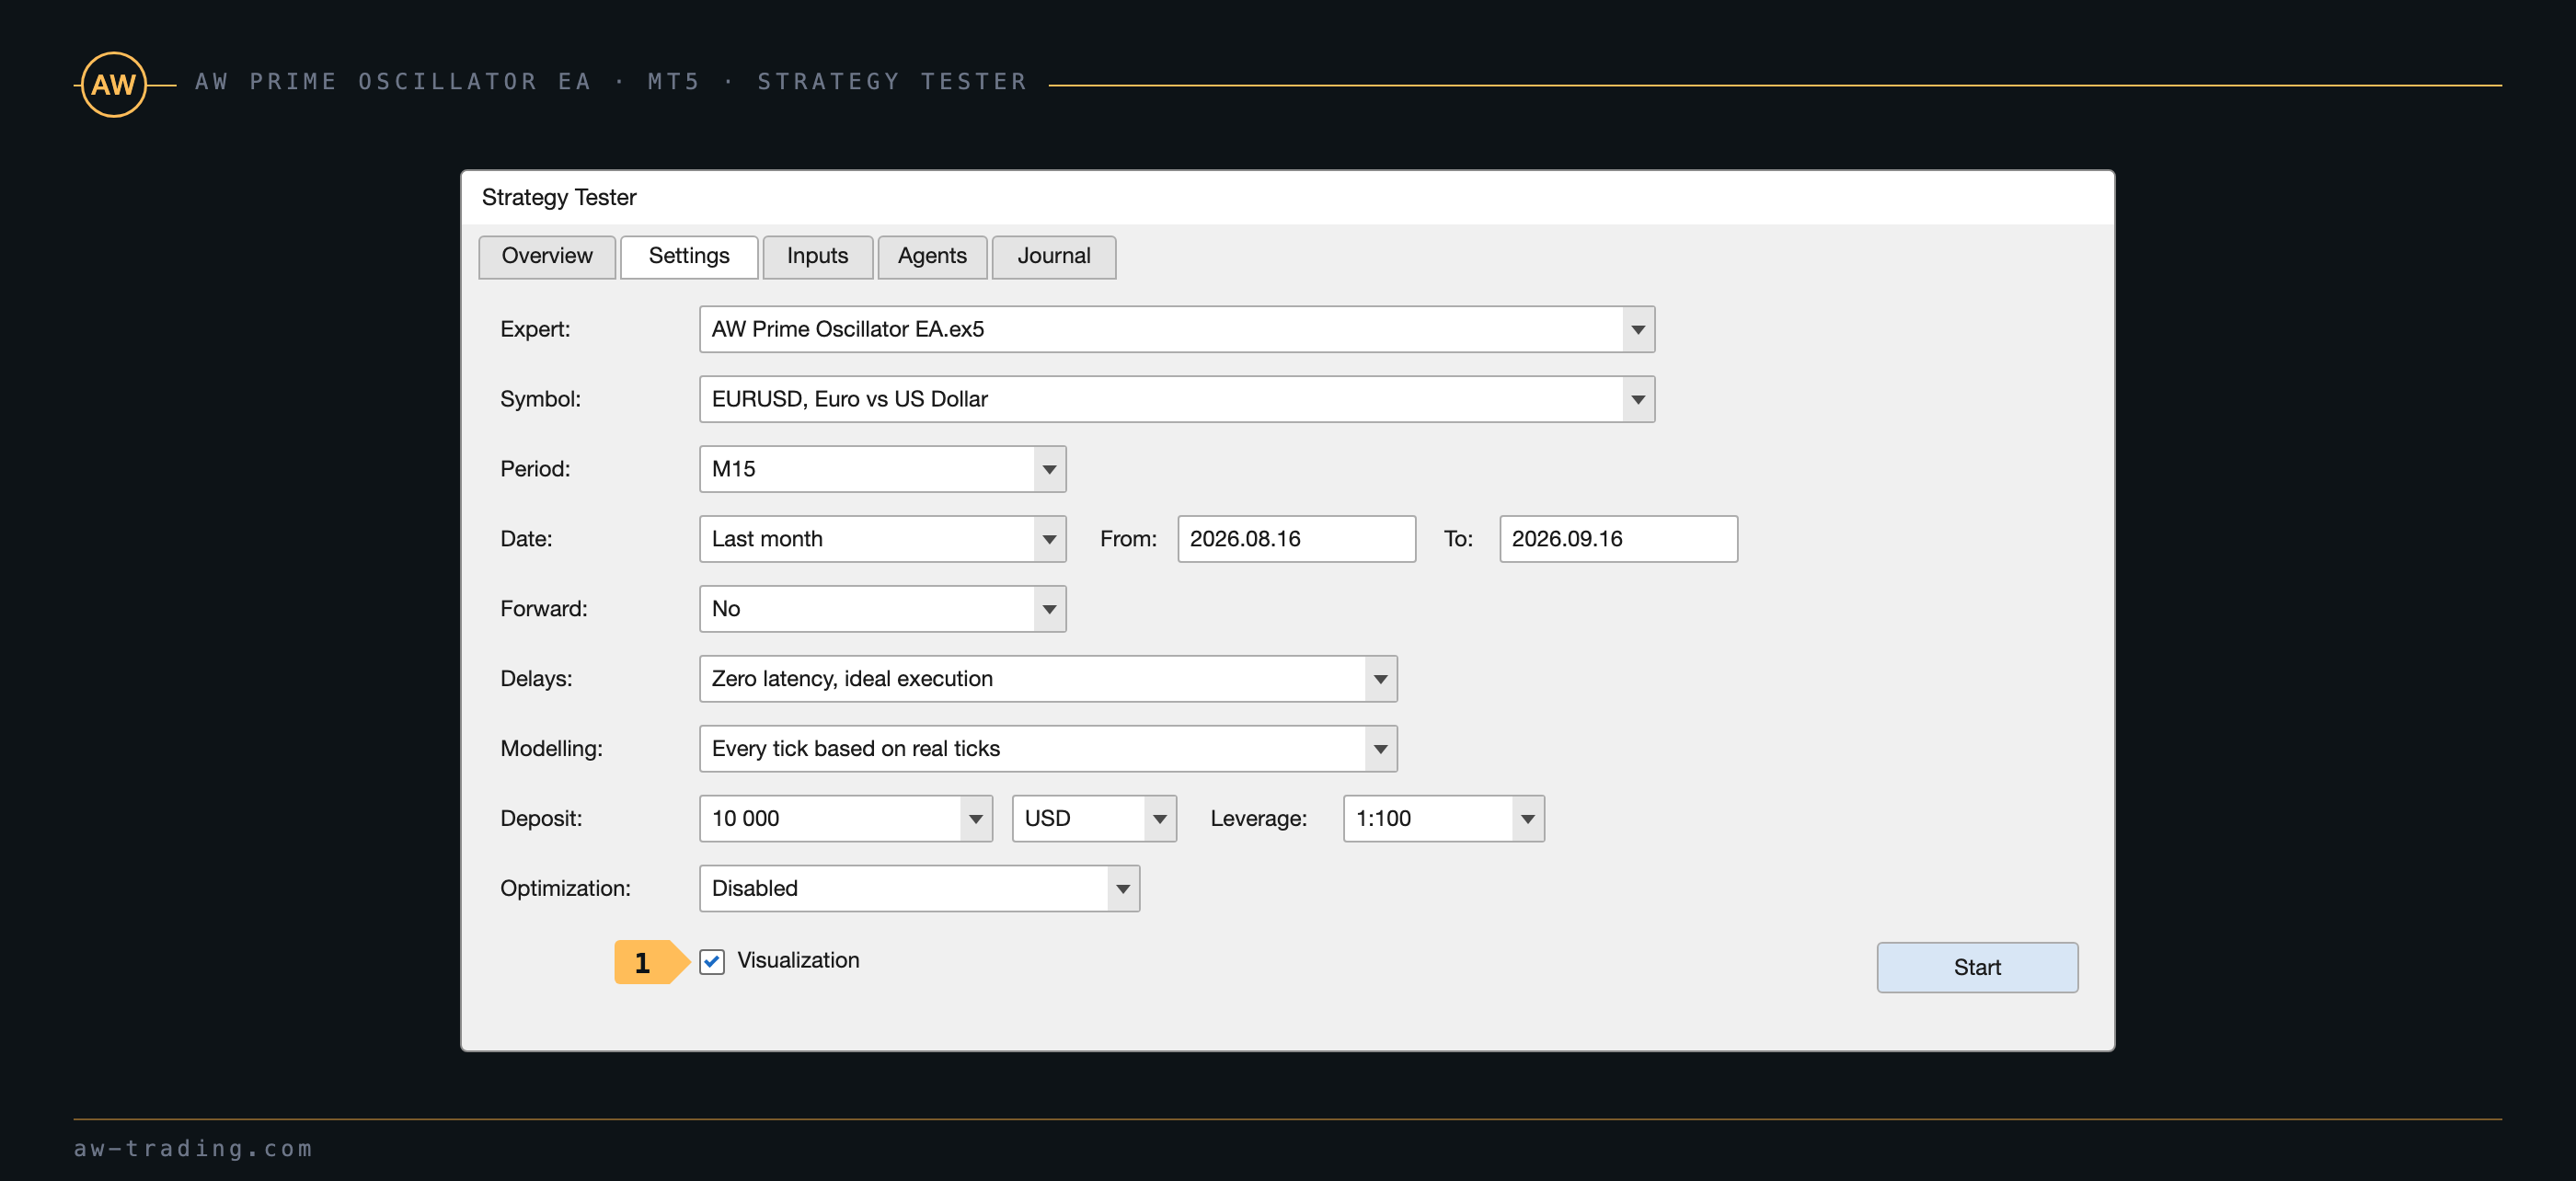
| No. | Tester setting |
|---|---|
| 1 | The Visualization checkbox. Without it the test runs faster, but there are no chart graphics and no panel. |
Checks before running the EA on an account:
- Choosing the symbol and timeframe the EA will trade. Lower timeframes give more signals, higher timeframes give fewer.
- Running a test with the default settings and checking the number of trades and the maximum drawdown in the tester report.
- Adjusting TakeProfit in Points, Step for grids, Multiplier for size of orders and Maximum number of orders to fit the drawdown the deposit can withstand. The grid volume calculation is in section 4.
- Repeating the test in Visualization mode to see how the EA manages the basket: the TP lines on the chart, the close marks, the panel.
Without visualization the panel is not built, which does not change the trading logic: test results with and without the panel are identical.
3. TakeProfit and StopLoss
TakeProfit is virtual. No TakeProfit level is set in the order. The EA calculates the side breakeven itself (the price at which the floating result of all orders of the side, including swaps and, in the MT4 version, commissions, equals zero) and closes the whole side when price has moved TakeProfit in Points away from the breakeven and the side is in profit. For buys the target is above the breakeven, for sells below it. The level is drawn on the chart as a dotted line labelled TP Buy or TP Sell and moves with every new order in the basket.
Buy target = buy breakeven + TakeProfit in Points. Sell target = sell breakeven - TakeProfit in Points.
For example, the first Buy order is opened at 1.15400, and TakeProfit in Points is 100 on 5-digit quotes. While there is only one order, the breakeven equals the open price and the target sits at 1.15500. After an averaging order at 1.15000 the breakeven drops to about 1.15200, and the target moves to 1.15300, closer to the current price.
StopLoss. The StopLoss Mode variable in the SL&TP SETTINGS section selects one of three modes.
| Mode | What it does |
|---|---|
| Without StopLoss | No stop, the side closes only at TakeProfit or with a panel button |
| Use Fixed StopLoss | Each order gets a StopLoss at a distance of StopLoss in Points from its open price. The stop is set in the order itself, and if the broker rejects it because of the minimum distance, the EA places the stop on the next tick |
| Exit on opposite signal | The whole side closes on an opposite signal of the indicator. An order in the opposite direction then opens on the same bar under the general entry rules |
Why did the side not close even though price reached the TP line? Closing requires two conditions: price beyond the line and a floating result of the side above zero. Buys are checked against the line at the Bid price and sells at the Ask price, while the candles on the chart are built from Bid, so sells close when the price on the chart has moved beyond the TP Sell line by an extra distance equal to the spread. Swap is already accounted for in the breakeven and shifts the line itself. The MT4 version accounts for the broker's commission the same way, while in the MT5 version the commission is not included in the result.
4. The averaging grid and overlap of the outermost orders
The grid is enabled by the Use grids variable in the GRIDS SETTINGS section. When price moves against the position, the EA opens averaging orders in the same direction, each with a volume no smaller than the previous one, and the basket breakeven moves closer to price.
Step. An averaging order opens when price has moved away from the outermost order of the side by the grid step. The step is Step for grids multiplied by Step multiplier for each next order as many times as there are orders of the side already open, so even the first averaging order needs a step larger than Step for grids. With a multiplier of 1 the step is constant and equals Step for grids.
Step of the N-th averaging order = Step for grids × Step multiplierN points, where N is the number of orders of the side that are already open.
For example, with Step for grids 400 and Step multiplier 1.3, the first averaging order opens 520 points from the first order, the second 676 points from the first averaging order, the third 879 points from the second.
Volume. The volume is calculated from the volume of the first order, not from the last one: Size of the order is multiplied by Multiplier for size of orders raised to the power of the number of open orders of the side and rounded to the broker's volume step. If after rounding the volume is not larger than the largest open order, the volume of that order multiplied by the multiplier is used instead.
Volume of the N-th averaging order = Size of the order × Multiplier for size of ordersN, rounded to the volume step. If it is not larger than the largest open order of the side, the volume = that order × Multiplier for size of orders. The volume is capped at Maximum size of orders.
For example, with Size of the order 0.01 and Multiplier for size of orders 1.35: 0.01 × 1.35 = 0.0135, which the EA rounds to the volume step, giving 0.01; the third order is 0.01 × 1.35 × 1.35 = 0.018, that is 0.02; then 0.03, 0.04, 0.05, 0.06, 0.08. The first grid levels have the same volume because of rounding, and growth starts from the third order.
Averaging conditions. An averaging order opens only on a bar of the matching color: buys are averaged after a bullish bar, sells after a bearish one. With Averaging trend filtering enabled, averaging requires the slow line trend to match the direction of the side. The number of orders of the side does not exceed Maximum number of orders, and averaging orders are subject to the working hours, the maximum spread and the one order per bar rule.
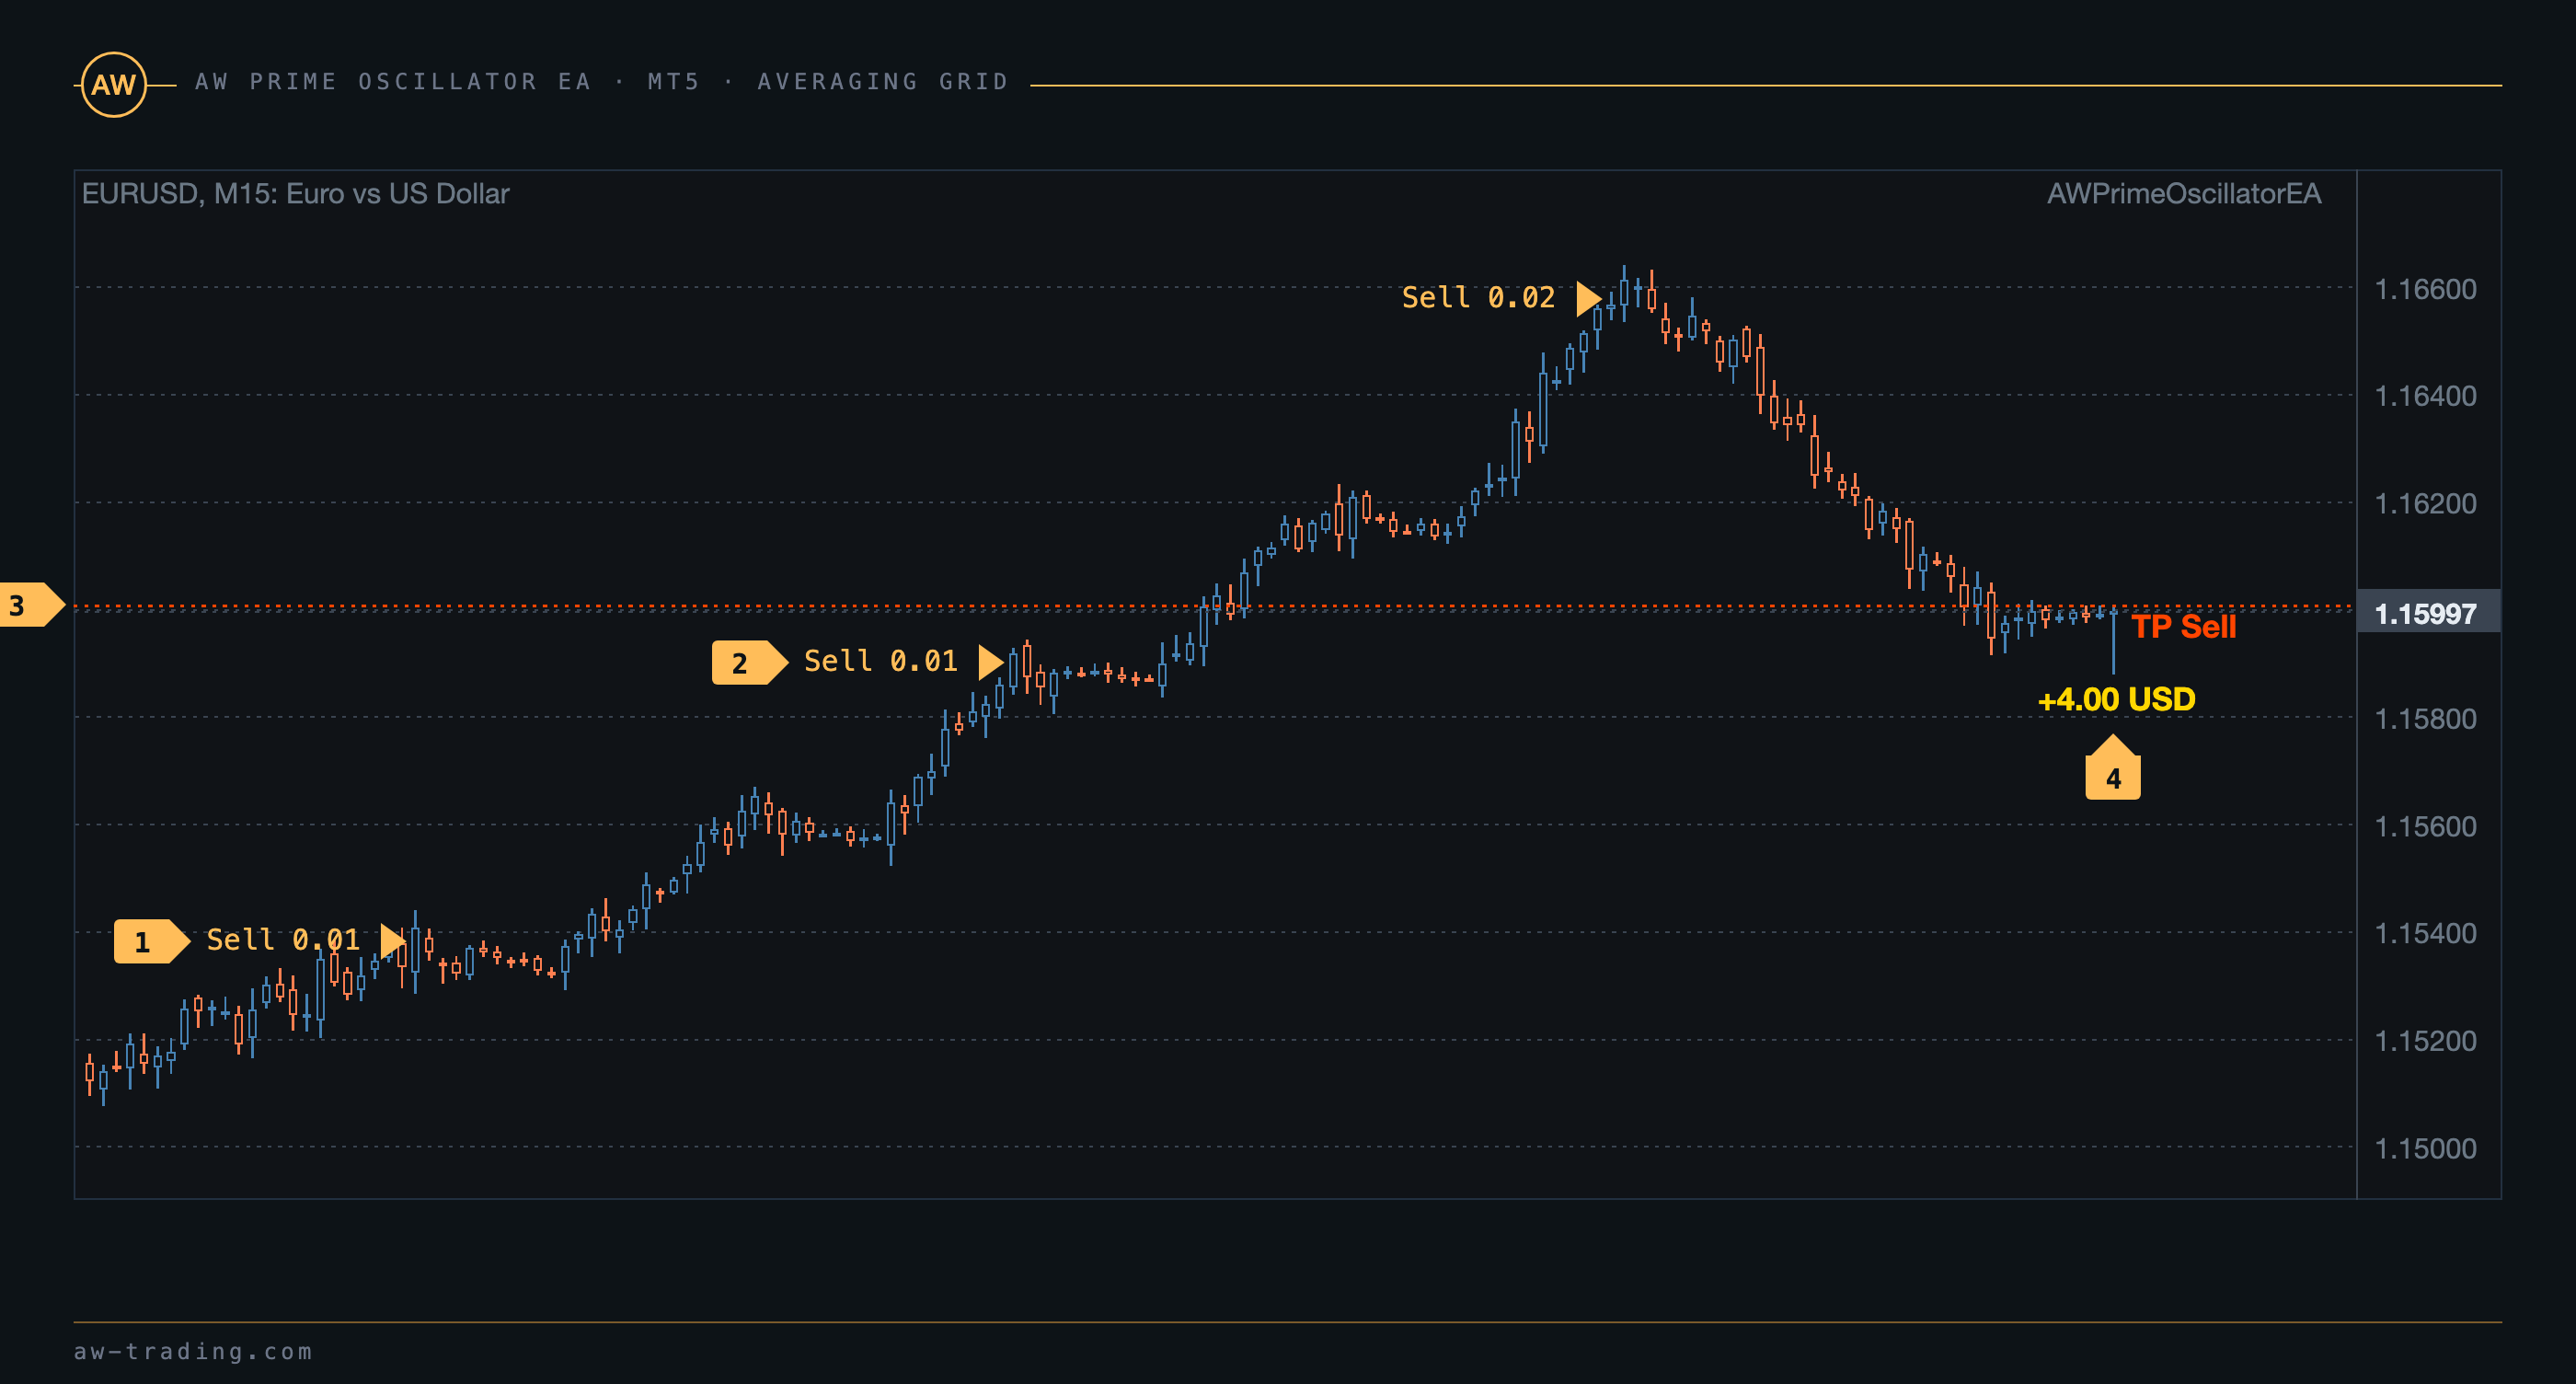
| No. | On the chart |
|---|---|
| 1 | The first Sell order, opened on a signal. |
| 2 | Two averaging orders at steps above the outermost order: the first with the same volume of 0.01, because 0.01 × 1.35 is rounded to the volume step, the second already at 0.02. |
| 3 | The TP Sell line below the breakeven of the three-order basket. |
| 4 | The close mark with the result of the side. Buy marks are placed above the bar, sell marks below it. |
Overlap of the outermost orders. The Allow overlap TP last and first average orders variable enables closing in pairs. When the number of orders of the side exceeds Allow overlap TP after number of orders and the side as a whole is at a loss, the EA watches the pair made of the order nearest to price and the farthest one. As soon as the combined result of the pair is above zero and price has moved TakeProfit in Points away from the breakeven of the pair, both orders close and the basket gets lighter.
Grid risk. The grid drawdown is determined by the step, the multiplier and the maximum number of orders. For low risk the step is larger, the multiplier is closer to 1.2 and the maximum number of orders is small; for high risk the step is smaller and the multiplier is higher. The step is set in points, and on gold and indices the price covers a different number of points per bar than on currency pairs, so the step for them is tuned from scratch in the tester.
The grid in brief. An averaging order opens after a step on a bar of the matching color, its volume is derived from the first order by the multiplier, the target is measured from the breakeven of the whole basket, and everything closes at once.
5. Filters: working hours, spread, higher timeframe trend
Working hours. Enable work with TimeOuts turns the window on, and Beginning of time for work and End of time for work set its boundaries in server time in the HH:MM format. The window can span midnight, for example from 22:00 to 06:00. Outside the window the EA opens neither first orders nor averaging orders, but it still closes sides at TakeProfit and at the stop and shows the Advisor in sleep mode status. Open orders are not closed when the window ends.
Spread. No order is sent while the current spread is larger than Maximum spread in points. The check runs on every tick, and if the spread returns to normal within the same bar, the signal order opens with a delay.
Higher timeframe trend. Use additional Prime Oscillator trend filtering enables a second calculation of the indicator on the timeframe set by Period for multitimeframe filter. A buy opens only in an uptrend on the higher timeframe, a sell only in a downtrend. The higher timeframe trend is shown in the Trend filter line of the panel. While the history of the higher timeframe is still loading, there is no entry.
One order per bar. One order per bar filter prevents two orders of the same side from opening on one bar, averaging orders included. The rule looks at the bar of the last order sent for the side, so if an order opened and closed on one bar, no new order of that side opens on the same bar.
New cycle. When Allow to open new orders after close is disabled, no first orders are opened: the EA manages the open baskets until they close and then stops. Averaging continues in the meantime.
6. The EA panel
The panel sits in the upper left corner of the chart. The Order Size bar for opening orders is placed separately, in the lower right corner, and stays in place when the panel is collapsed.
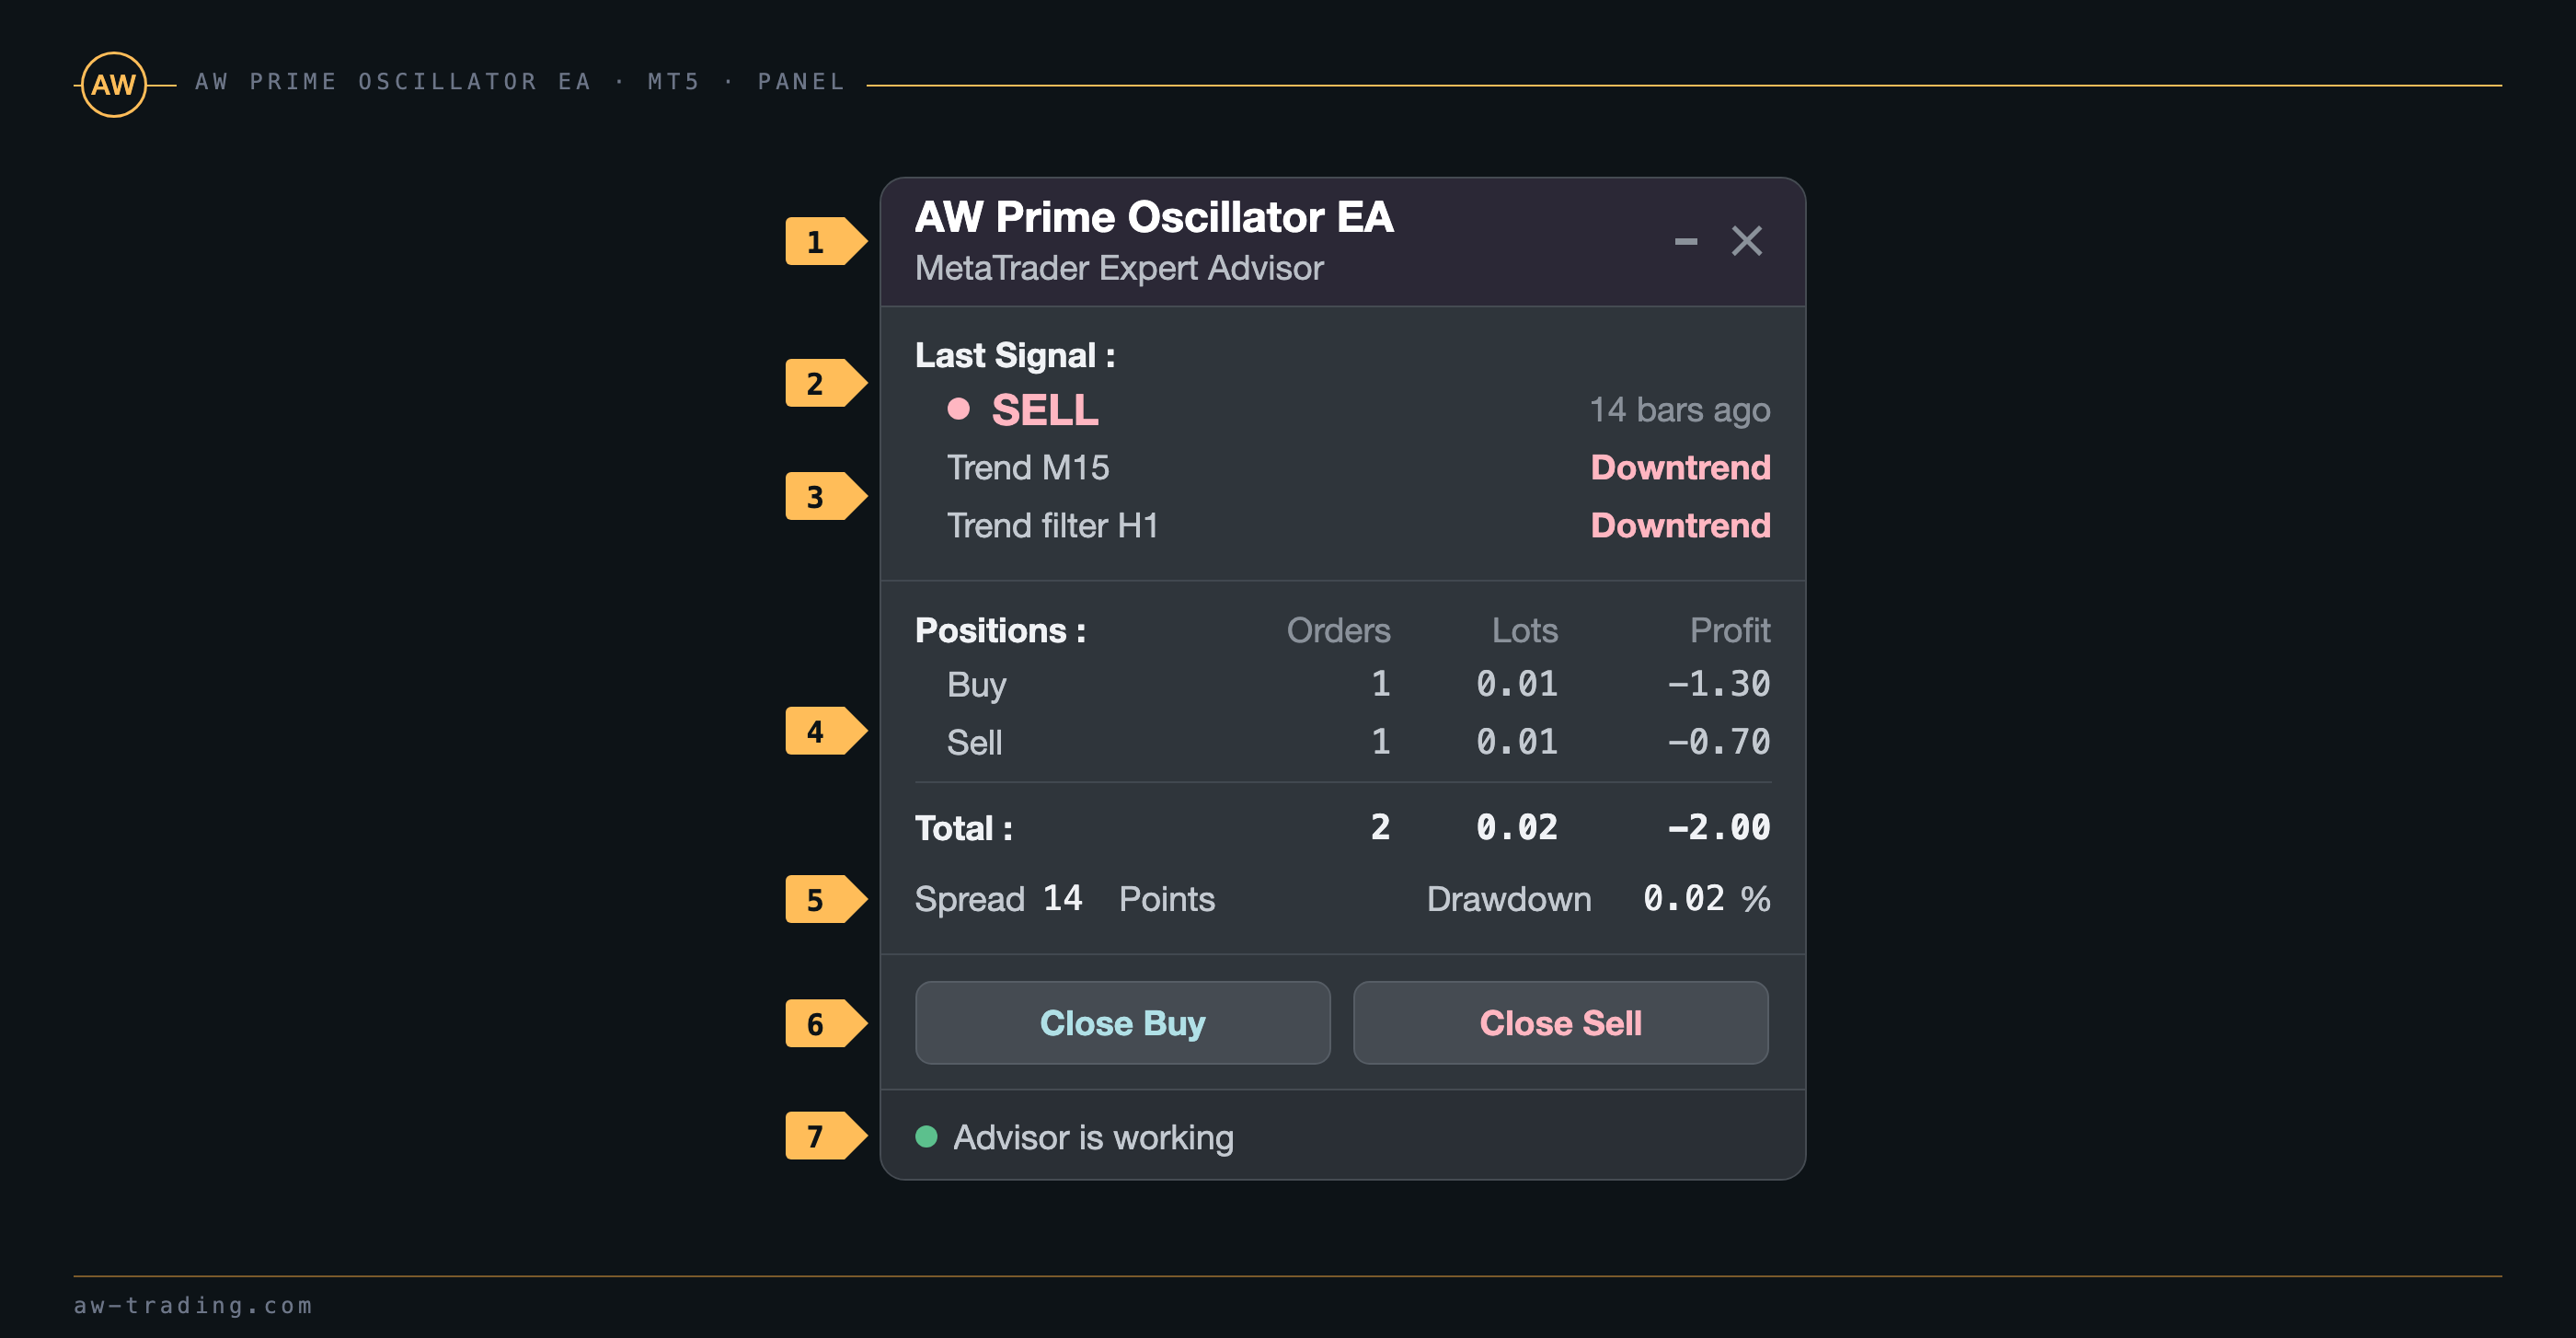
| No. | Panel block |
|---|---|
| 1 | The header and the window buttons. The dash collapses the panel into a pill, the cross removes the EA from the chart after confirmation in a dialog. In the strategy tester the dialog is not shown and the cross does not work. |
| 2 | Last Signal. The direction of the last indicator signal in the color of its side and its age in bars. Until a first signal appears in the history, the line reads NO SIGNAL YET. |
| 3 | Trend with the chart timeframe and Trend filter with the filter timeframe. Uptrend or Downtrend according to the slow line. With the filter disabled, the second line reads Off. |
| 4 | Positions. The number of orders, volume and result for buys, for sells and in total. The result includes swap, and in the MT4 version also the broker's commission. |
| 5 | Spread in points and Drawdown as a percentage of the balance, based on the floating loss of open orders. When the result is positive, the drawdown is 0.00. |
| 6 | Close Buy and Close Sell. They close all orders of the side at once, without a confirmation dialog. |
| 7 | The EA status with the status LED: Advisor is working, Advisor in sleep mode outside the working hours, Trades are not allowed with algo trading disabled. In an alert state the panel border and the LED turn the color of the status. |
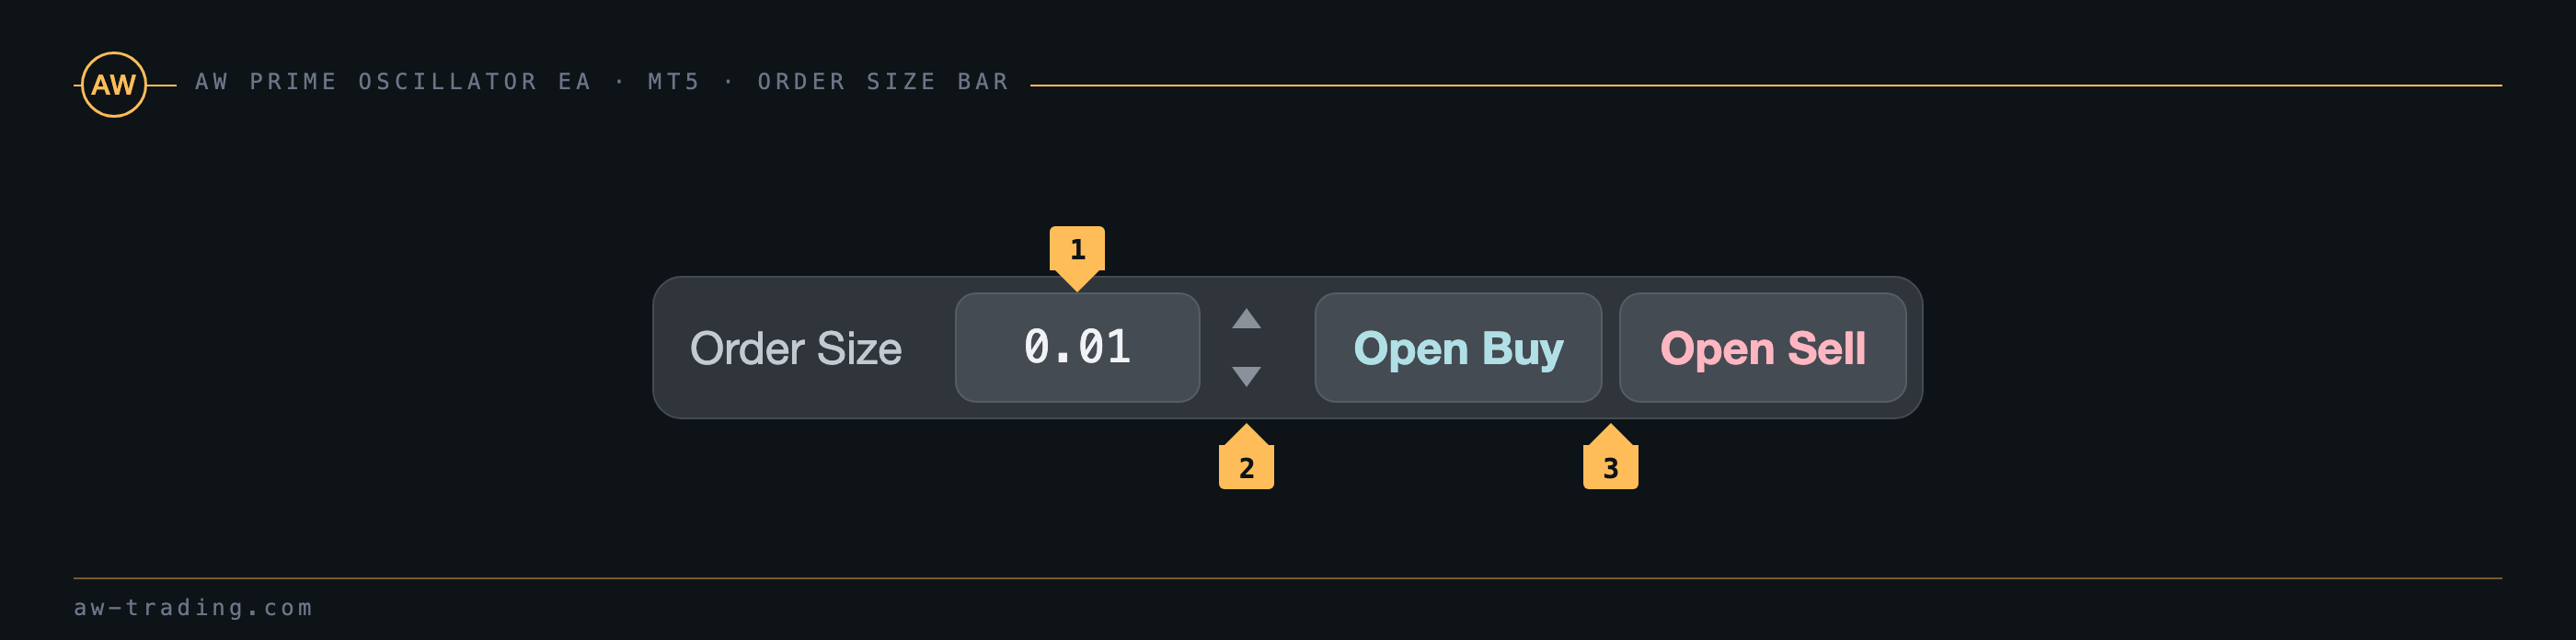
| No. | Order Size bar |
|---|---|
| 1 | The volume field. At startup it holds Size of the order, and a value can be typed in from the keyboard. |
| 2 | The arrows change the volume by one volume step of the broker. |
| 3 | Open Buy and Open Sell open a market order with the volume from the field. The order gets the EA's Magic and is then managed as usual: averaging, TakeProfit and the stop work for it the same way as for a signal order. |
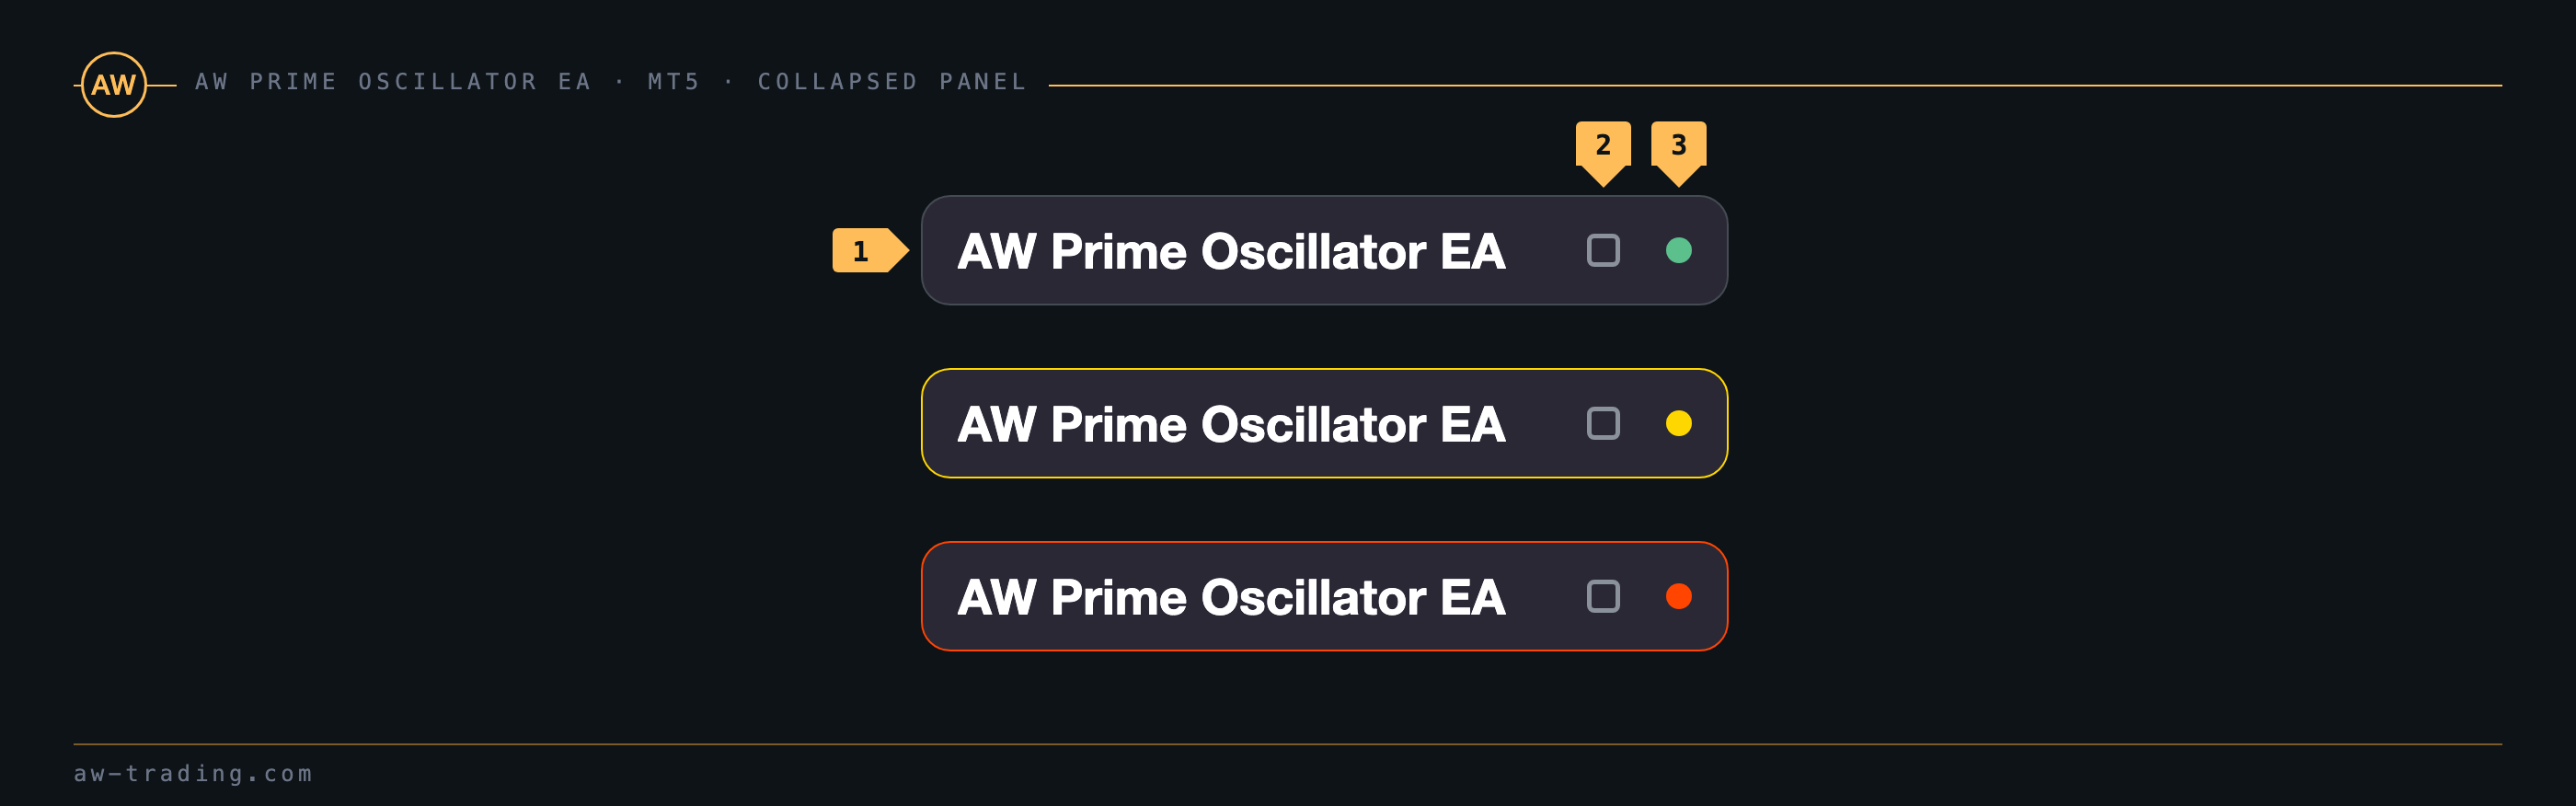
| No. | Pill |
|---|---|
| 1 | The logo. The pill sits in place of the panel and does not cover the chart. |
| 2 | The button that expands the panel back. |
| 3 | The status LED: green while working, gold in sleep mode, red when trading is not allowed. The pill border changes color together with the LED. |
The panel updates once per second and writes only changed values to its objects. The GRAPHICS SETTINGS section sets the color scheme with Color Cheme for Panels, the panel display with Show Panel, the panel size with Panel size and the font size with Font size. Panel size set to Auto picks the scale by screen DPI.
7. Notifications
The EA sends a notification when a side closes: at TakeProfit, on an opposite signal or when an overlap pair closes. The three channels are enabled separately in the NOTIFICATIONS SETTINGS section: Send push notifications when closing orders, Send mails when closing orders, Send alerts when closing orders. Push requires a MetaQuotes ID in the terminal settings, e-mail requires a filled-in Email tab.
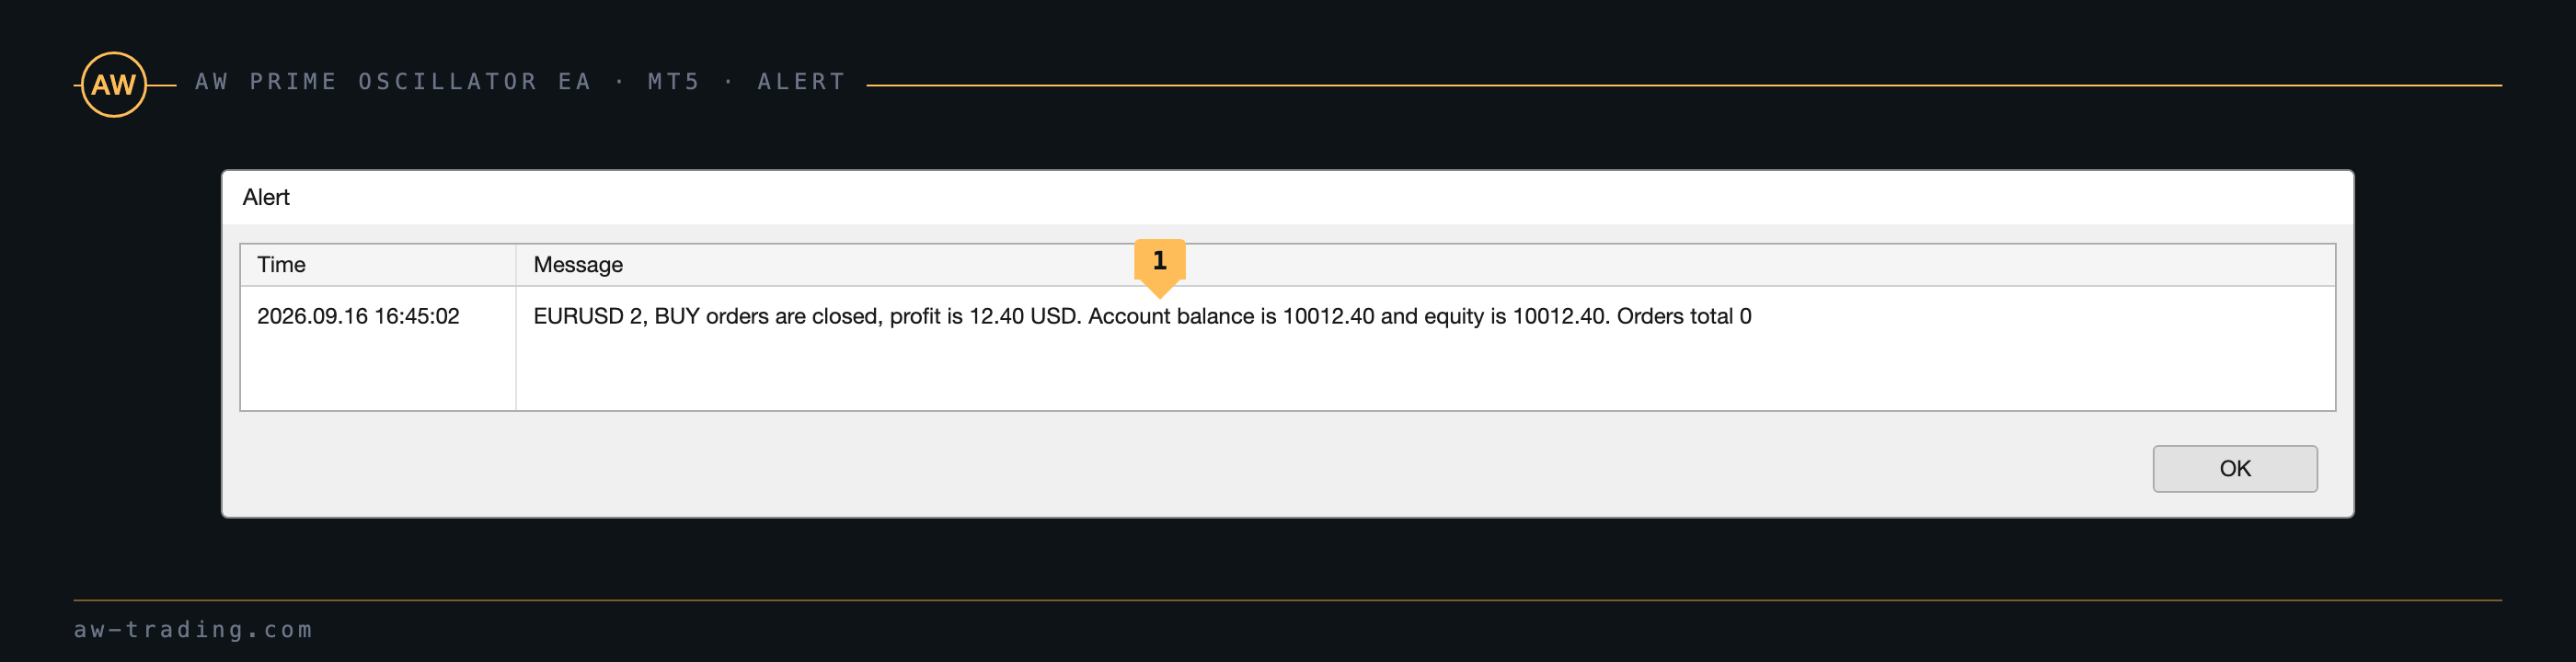
| No. | Notification |
|---|---|
| 1 | The message text: symbol, number of closed orders, side, close result, account balance and equity, number of remaining positions. |
8. Input settings
Variable names are given as they appear in the settings window.
MAIN SETTINGS
| Variable | What it does |
|---|---|
| Can EA work in both directions in same time | Allows a side to open while the opposite side is not empty. Not used on netting accounts |
| Size of the order | The volume of the first order of the side and the base for the averaging volume |
| Enable AutoLot size calculation | The first order volume is calculated from the balance and recalculated when the basket is empty |
| Volume of deposit for one "Size of the order" with AutoLot | The balance per Size of the order. Volume = Size of the order / this value × balance. For example, 0.01 / 1000 × 5000 = 0.05 |
SL&TP SETTINGS
| Variable | What it does |
|---|---|
| TakeProfit in Points (virtual, from breakeven) | The distance of the target from the side breakeven in points |
| StopLoss Mode | Without StopLoss, Use Fixed StopLoss or Exit on opposite signal, see section 3 |
| StopLoss in Points(if used) | The stop in points from the open price of each order in the Use Fixed StopLoss mode |
| Allow overlap TP last and first average orders | Closing the pair of the nearest and the farthest order, see section 4 |
| Allow overlap TP after number of orders | The overlap works when the side has more orders than this number |
GRIDS SETTINGS
| Variable | What it does |
|---|---|
| Use grids | Enables averaging orders |
| Averaging trend filtering | Averaging only when the slow line trend matches the direction of the side |
| Multiplier for size of orders | The multiplier of the averaging volume relative to the first order volume. The higher it is, the faster the breakeven catches up with price and the heavier the load on the deposit |
| Step for grids | The base grid step in points from the outermost order, see section 4. Zero disables the grid |
| Step multiplier for each next order (1 = off) | The step multiplier for each next averaging order |
| Maximum number of orders | The largest number of orders of one side, including the first |
PRIME OSCILLATOR SETTINGS
| Variable | What it does |
|---|---|
| High level of indicator | The upper level of the oscillator window, used for sell signals and the trend |
| Low level of indicator | The lower level, used for buy signals and the trend |
| Signals strategy | Fast oscillator signal or Signal by current trend, see section 1 |
| Fast oscillator period | The period of the fast line. The smaller it is, the more signals |
| Fast oscillator smooth | Smoothing of the fast line |
| Slow oscillator period | The period of the slow line. The EA adds 60 to the value, just as the indicator does |
| Slow oscillator smooth | Smoothing of the slow line |
MULTI-TIMEFRAME TREND SETTINGS
| Variable | What it does |
|---|---|
| Use additional Prime Oscillator trend filtering | Enables the higher timeframe trend filter, see section 5 |
| Period for multitimeframe filter | The filter timeframe. Current gives the trend of the chart |
WORKING TIME SETTINGS
| Variable | What it does |
|---|---|
| Enable work with TimeOuts | Enables the working hours |
| Beginning of time for work | Start of the window in server time, HH:MM |
| End of time for work | End of the window in server time, HH:MM |
NOTIFICATIONS SETTINGS
| Variable | What it does |
|---|---|
| Send push notifications when closing orders | Push to the mobile terminal |
| Send mails when closing orders | An e-mail through the Email tab of the terminal |
| Send alerts when closing orders | The Alert window in the terminal |
ADVISOR SETTINGS
| Variable | What it does |
|---|---|
| Orders Magic number | The identifier of the EA's orders, see section 9 |
| Comments of the EA's orders | The order comment |
| Maximum slippage in points | The allowed slippage on opening and closing |
| Maximum spread in points | No order is sent while the spread is higher |
| Maximum size of orders | The volume cap for one order, averaging orders and panel buttons included |
| Allow to open OP_BUY orders | Allows buys |
| Allow to open OP_SELL orders | Allows sells |
| Allow to open new orders after close | Allows first orders. When disabled, the EA only manages the open baskets until they close |
| One order per bar filter | No more than one order of a side per bar, see section 5 |
GRAPHICS SETTINGS
| Variable | What it does |
|---|---|
| Show closed profit on chart | A result mark on the close bar: Show images on chart or Not Used |
| Color Cheme for Panels | Dark scheme or Light scheme |
| Show Panel | Shows the panel |
| Panel size | Auto by screen DPI, Small 100%, Medium 125%, Large 150% |
| Font size | The same scale for the font, Auto follows the panel size |
9. Identifiers and running on several charts
The EA manages only orders of its own symbol with the Orders Magic number from the settings. Orders with a different Magic on the same symbol are neither counted nor closed by the EA, including through the panel buttons. Orders opened from the Order Size bar get the EA's Magic and are then managed like signal orders.
On several charts of the same symbol the EA is attached with different Orders Magic number values, otherwise two copies will manage one basket. On different symbols the Magic can be the same.
Note. When the EA is removed from the chart, open orders stay on the account, while the TakeProfit lines and the panel are deleted. After a restart the EA picks up the orders with its Magic and continues managing the basket.
Buy AW Prime Oscillator EA:
MT5 version
👉 https://www.mql5.com/en/market/product/152876
MT4 version
👉 https://www.mql5.com/en/market/product/196715
AW Prime Oscillator indicator
👉 https://www.mql5.com/en/market/product/64681

AW Trading Software