1. What it is
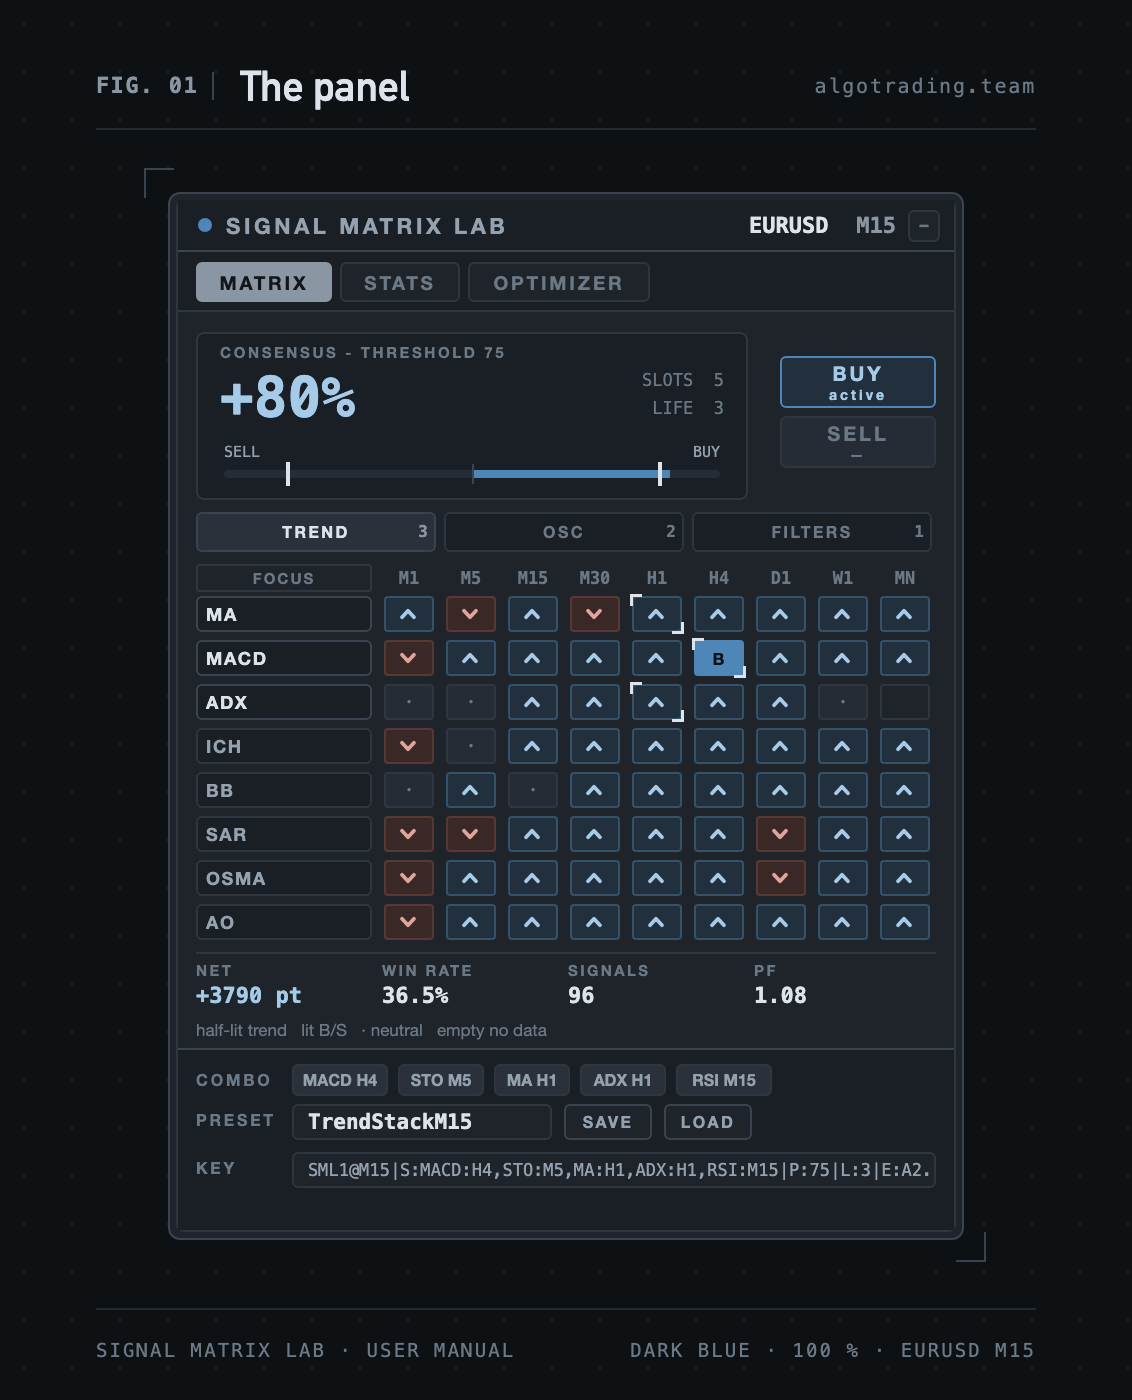
Signal Matrix Lab is a workbench for building and testing trading systems on the chart itself. Sixteen standard indicators sit in the rows, nine timeframes in the columns, and the cell where they meet shows what that indicator says on that period right now. Cells are picked into a combination, the combination votes, the vote turns into a signal, and the signal is run over history and scored. All of it happens on one chart, without a single run of the strategy tester.
The indicator places no orders. It answers the question "what would this system have done", and hands the answer to an Expert Advisor — either as a key string, or through iCustom buffers.
- MetaTrader5 Version of the indicator product page is Here
Fig. 1. The panel on the MATRIX tab.
2. Installation
The indicator is distributed through the MQL5 Market and is installed from the terminal; no files are copied by hand.
- The product is listed on the Market tab of the terminal's Toolbox window, or on its product page at mql5.com. Buying, renting and downloading the demo require a signed-in MQL5.community account: Tools → Options → Community.
- After the purchase the terminal downloads and installs the product itself. It appears in the Navigator under Indicators → Market.
- The indicator is dragged from the Navigator onto a chart.
Updates arrive in the same place, in the list of purchased products on the Market tab. The number of activations is stated on the product page. The free demo from the Market, like every Market demo, runs in the Strategy Tester only; how the panel behaves there is covered in Limitations.
The panel appears in the corner of the chart and drags by its title bar. The − button folds it into a strip that keeps the live consensus percentage. The panel position, the combination, the indicator parameters, the filters and the optimizer criteria are stored per symbol and survive a timeframe change, a terminal restart and a reinitialisation.
The chart timeframe is the grid the trades and the statistics are counted on. Cells live on their own periods, but entry, exit and result always follow the bars of the chart.
3. Five-minute start
Five minutes is enough for a first tested system.
A few clicks on the matrix build a combination; three to five cells is the usual size. A sensible first set is one slow indicator on a higher timeframe for direction and one or two fast ones on the working timeframe for entry. Chips for the picked slots appear at the bottom of the panel, and the row under the matrix fills with the net result, the win rate, the number of signals and the profit factor. The STATS tab shows the same system in detail. When the picture is not convincing, the OPTIMIZER tab looks for the composition on its own. A finished system is copied out of the KEY field as a single line and saved under a name with SAVE.
4. How the panel is laid out
Fig. 2. The MATRIX tab, zone by zone.
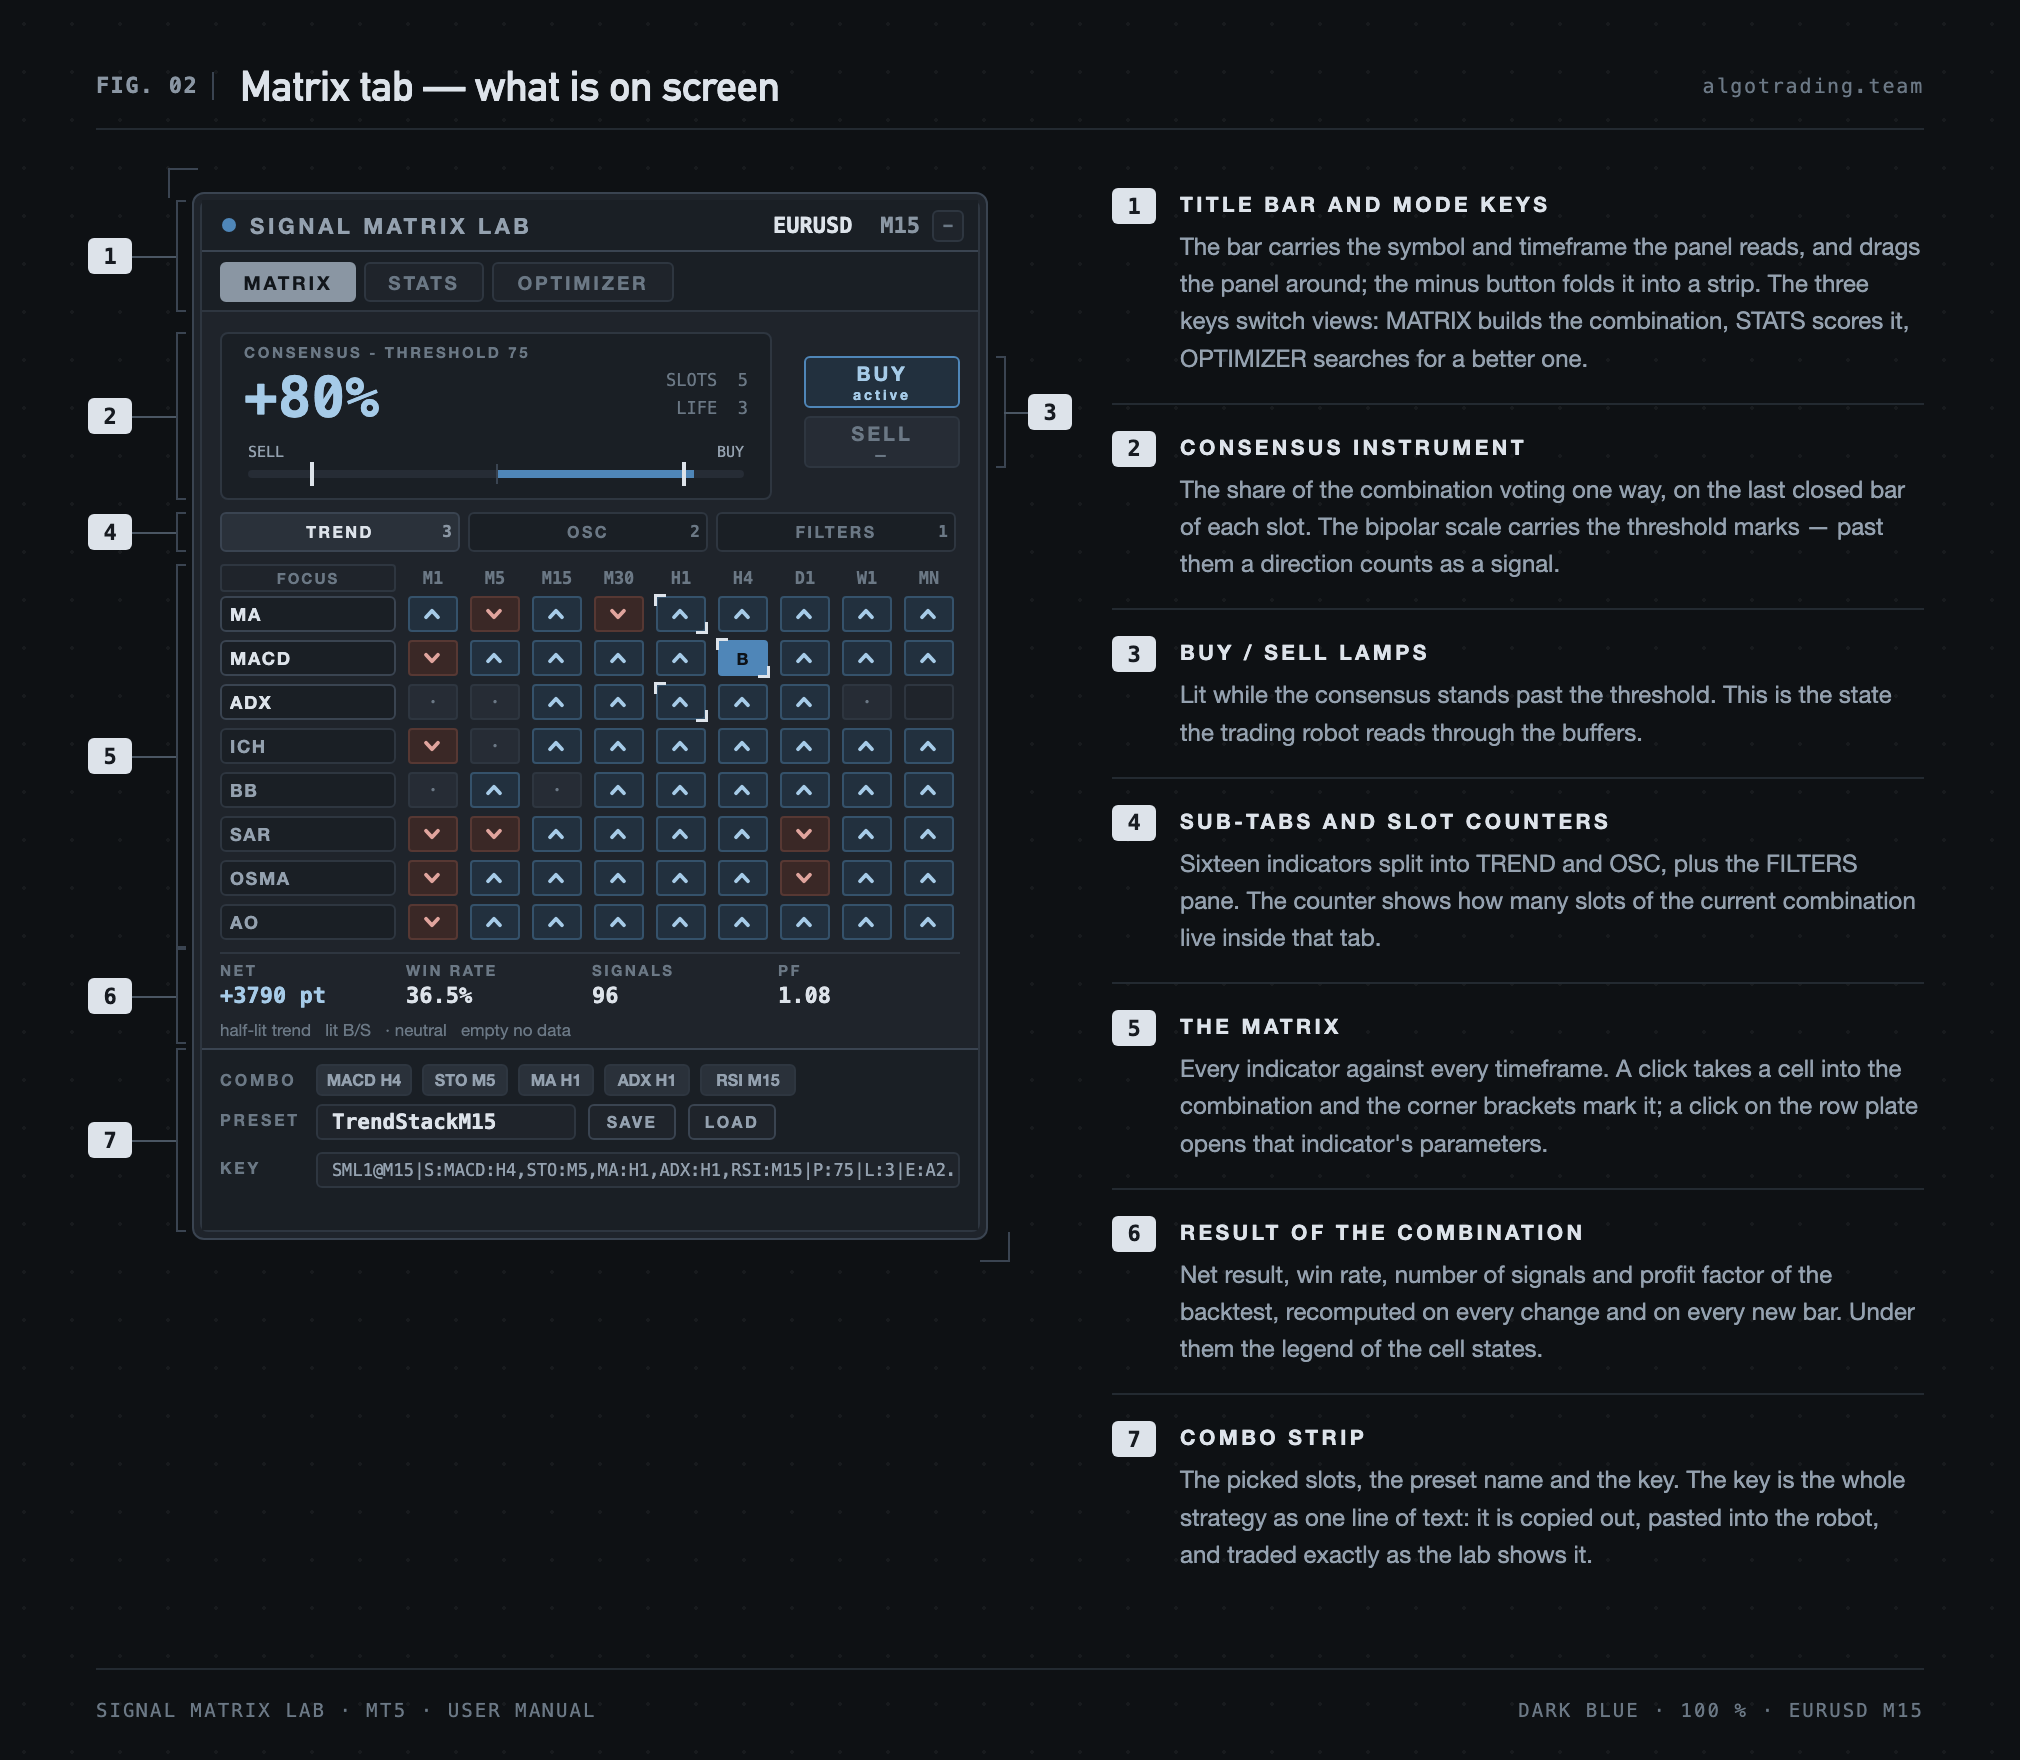
The title bar carries the symbol and timeframe of the chart, drags the panel, and folds it with the button on the right. Three keys below switch the views: MATRIX builds the combination, STATS scores it, OPTIMIZER searches for a better one.
The consensus instrument shows in large digits what share of the slots votes one way, and the bipolar scale under it carries the threshold marks — the points past which a direction counts as a signal. Two lamps sit to the right, BUY and SELL: the one whose level is reached is lit.
The matrix is split into three sub-tabs. TREND holds the eight trend indicators (MA, MACD, ADX, Ichimoku, Bollinger, SAR, OsMA, AO), OSC the eight oscillators (RSI, Stochastic, CCI, Williams %R, Momentum, RVI, DeMarker, MFI), and FILTERS the entry gates. The number on a sub-tab counts the slots of the combination inside it; on FILTERS it counts the armed filters.
The result of the current combination runs under the matrix, and below that the strip with the slot chips, the preset name and the key.
5. The cell and the combination
Fig. 3. Cell states, the row plate and the FOCUS switch.
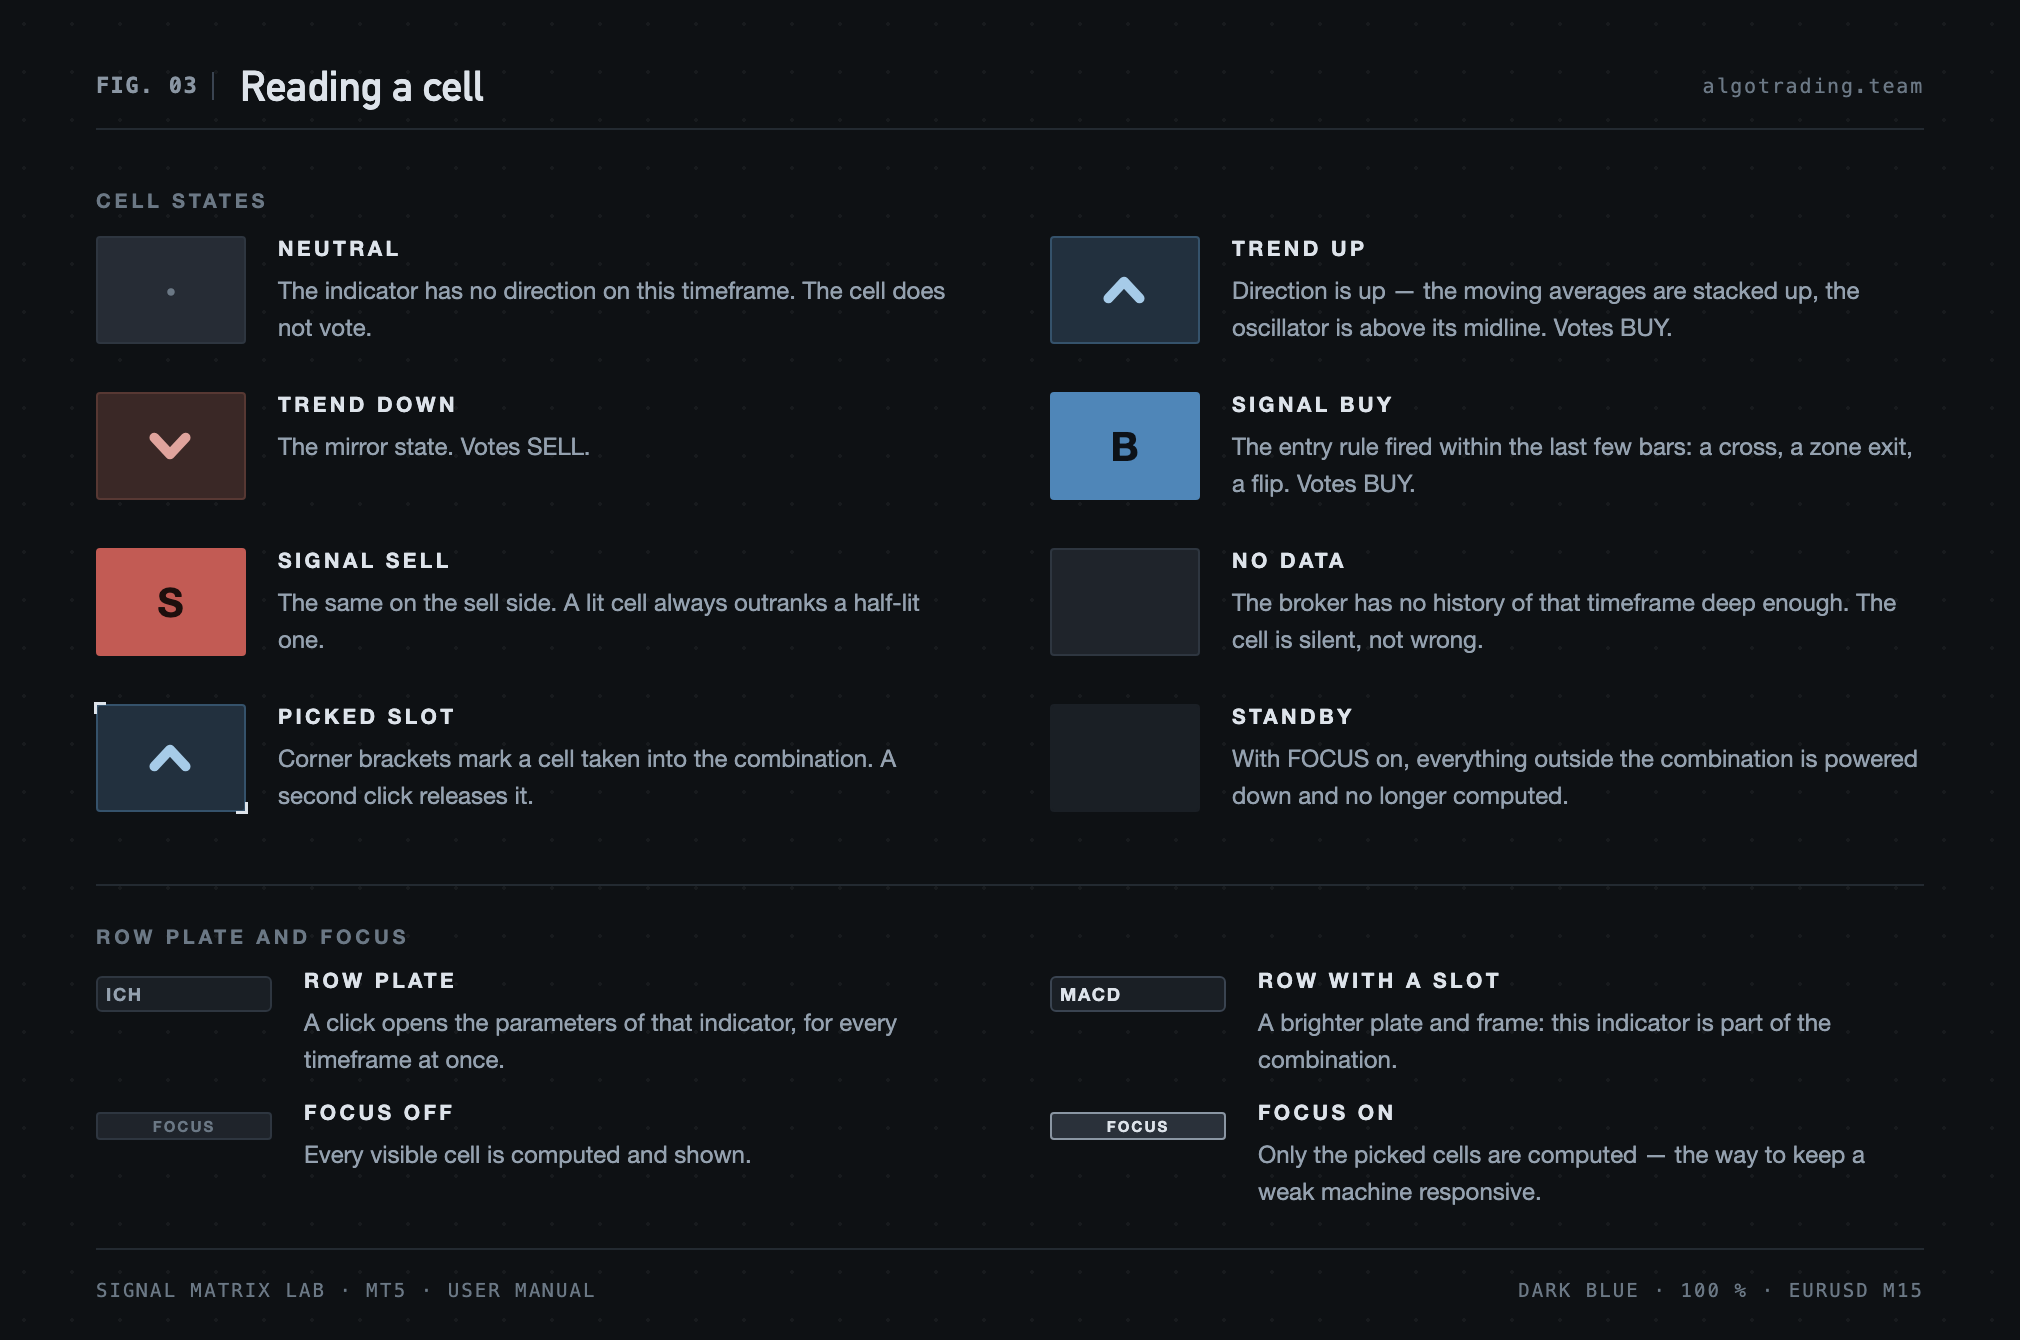
A cell lives on its own timeframe and is read off the last closed bar of that timeframe. A muted fill with a chevron means direction: for moving averages that is fast against slow, for oscillators the side of the midline, for Ichimoku the position of price against the cloud. A bright fill with a B or an S means the entry rule has fired — a cross, a zone exit, a SAR flip — and is still alive. A dot means neutral, and an empty cell means the broker has no history of that period deep enough for the window.
A cell signal holds for as many bars of its own timeframe as Signal lifetime says (three by default). While it holds, the cell votes as a signal rather than as a trend.
A click takes a cell into the combination — white brackets appear in its corners and a new chip at the bottom of the panel. A second click releases the slot. A click on the row plate opens the parameters of that indicator.
The FOCUS switch in the corner of the matrix powers down everything outside the combination and stops computing it. On a slow machine, or with many visible cells, that is a noticeable relief.
6. Indicator parameters
Fig. 4. The MACD settings popover, opened by a click on the row plate.
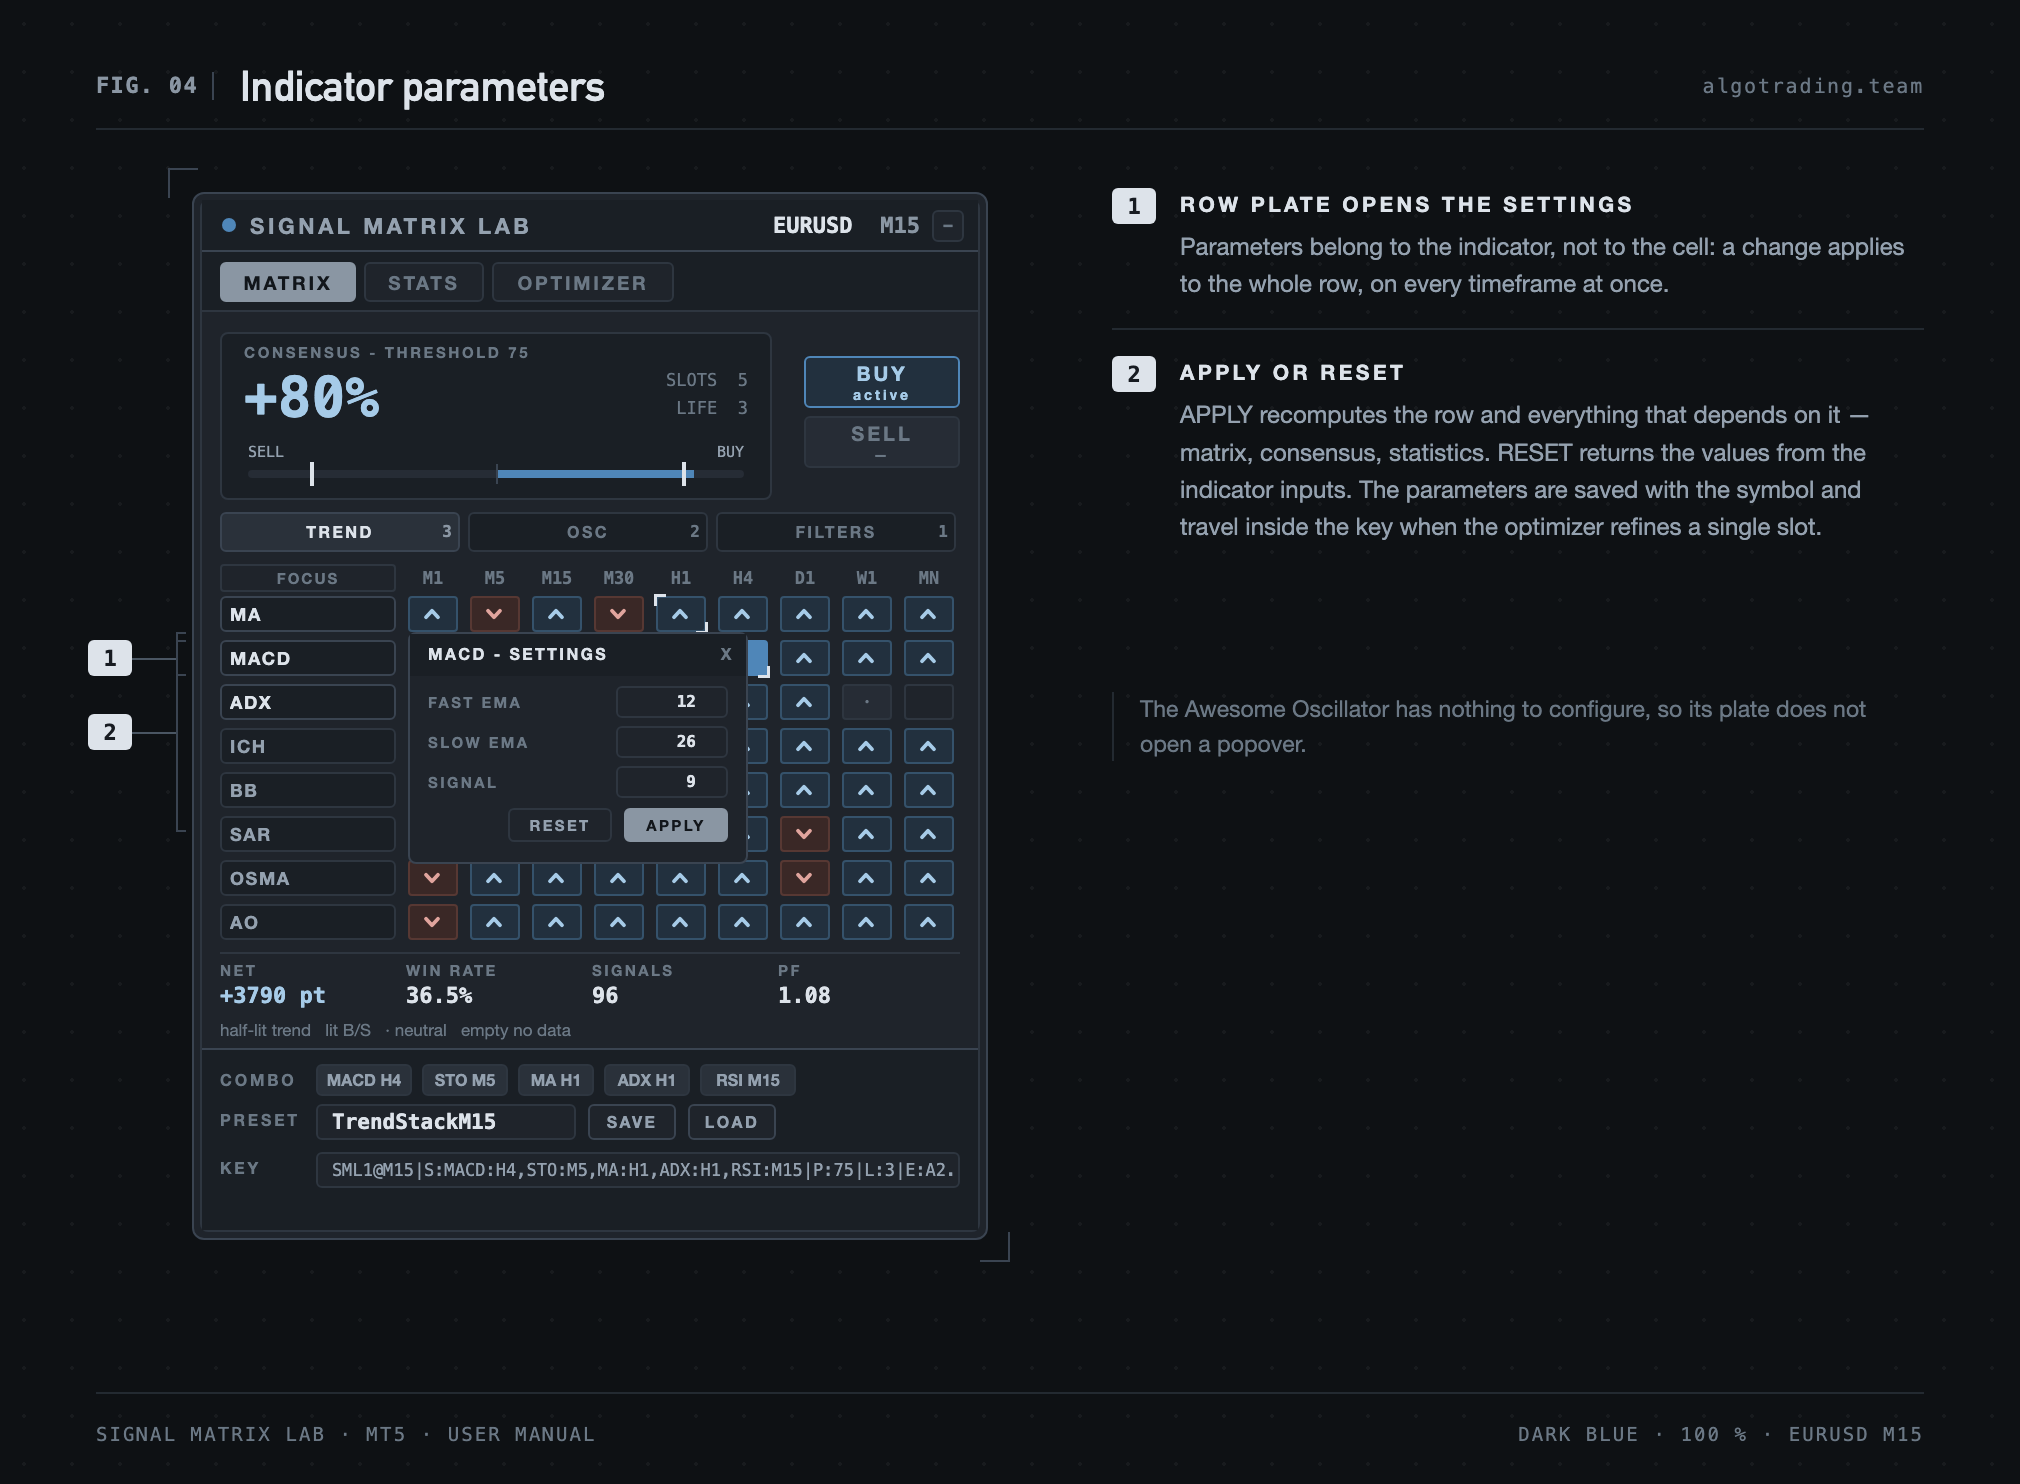
Parameters belong to the indicator, not to the cell: a change applies to the whole row at once, on every timeframe. APPLY recomputes the row and everything that depends on it; RESET returns the values from the indicator inputs. The set is stored with the symbol.
The Awesome Oscillator is the exception — it has nothing to configure, and its plate opens no popover.
7. Voting and the signal
Every slot casts one vote: +1 up, −1 down, 0 for neutral. A BUY level appears when the share of up-votes reaches Consensus threshold P (75 % by default), a SELL level mirrors it. The large percentage on the instrument and the lamps show exactly that state, live.
A signal is not the level but its edge. It appears the moment a level stands where it did not stand on the previous bar, and it is fixed on the close of the chart bar. That same edge produces the arrow on the chart, the alert and the trade in the statistics — three things that never disagree with each other in the lab.
One consequence is worth knowing in advance. The percentage on the instrument and the lit cells show the live state: every slot is read off its own last closed bar. The edge, on the other hand, is checked on the close of the chart bar. Until the current bar closes, a slot on a lower timeframe can already have changed colour while no trade exists yet — not a desynchronisation, but a different point of reference.
8. The trade model
A trade opens at the open of the bar after the signal bar — exactly what an Expert Advisor reading the last closed bar will do.
The stop is set either as k × ATR of the current timeframe or as a fixed number of points. The target is either a ratio to risk or, again, a fixed number. Three early exits can be added on top: on the opposite signal, on the consensus fading below a given percentage, and on a number of bars in the market. The spread cost is set by the Spread cost input and is subtracted from every trade.
When the stop and the target are both touched by the same bar, the order is resolved from minute history; without it the stop is counted. The result is never flattered.
9. Entry filters
Fig. 5. The FILTERS sub-tab.
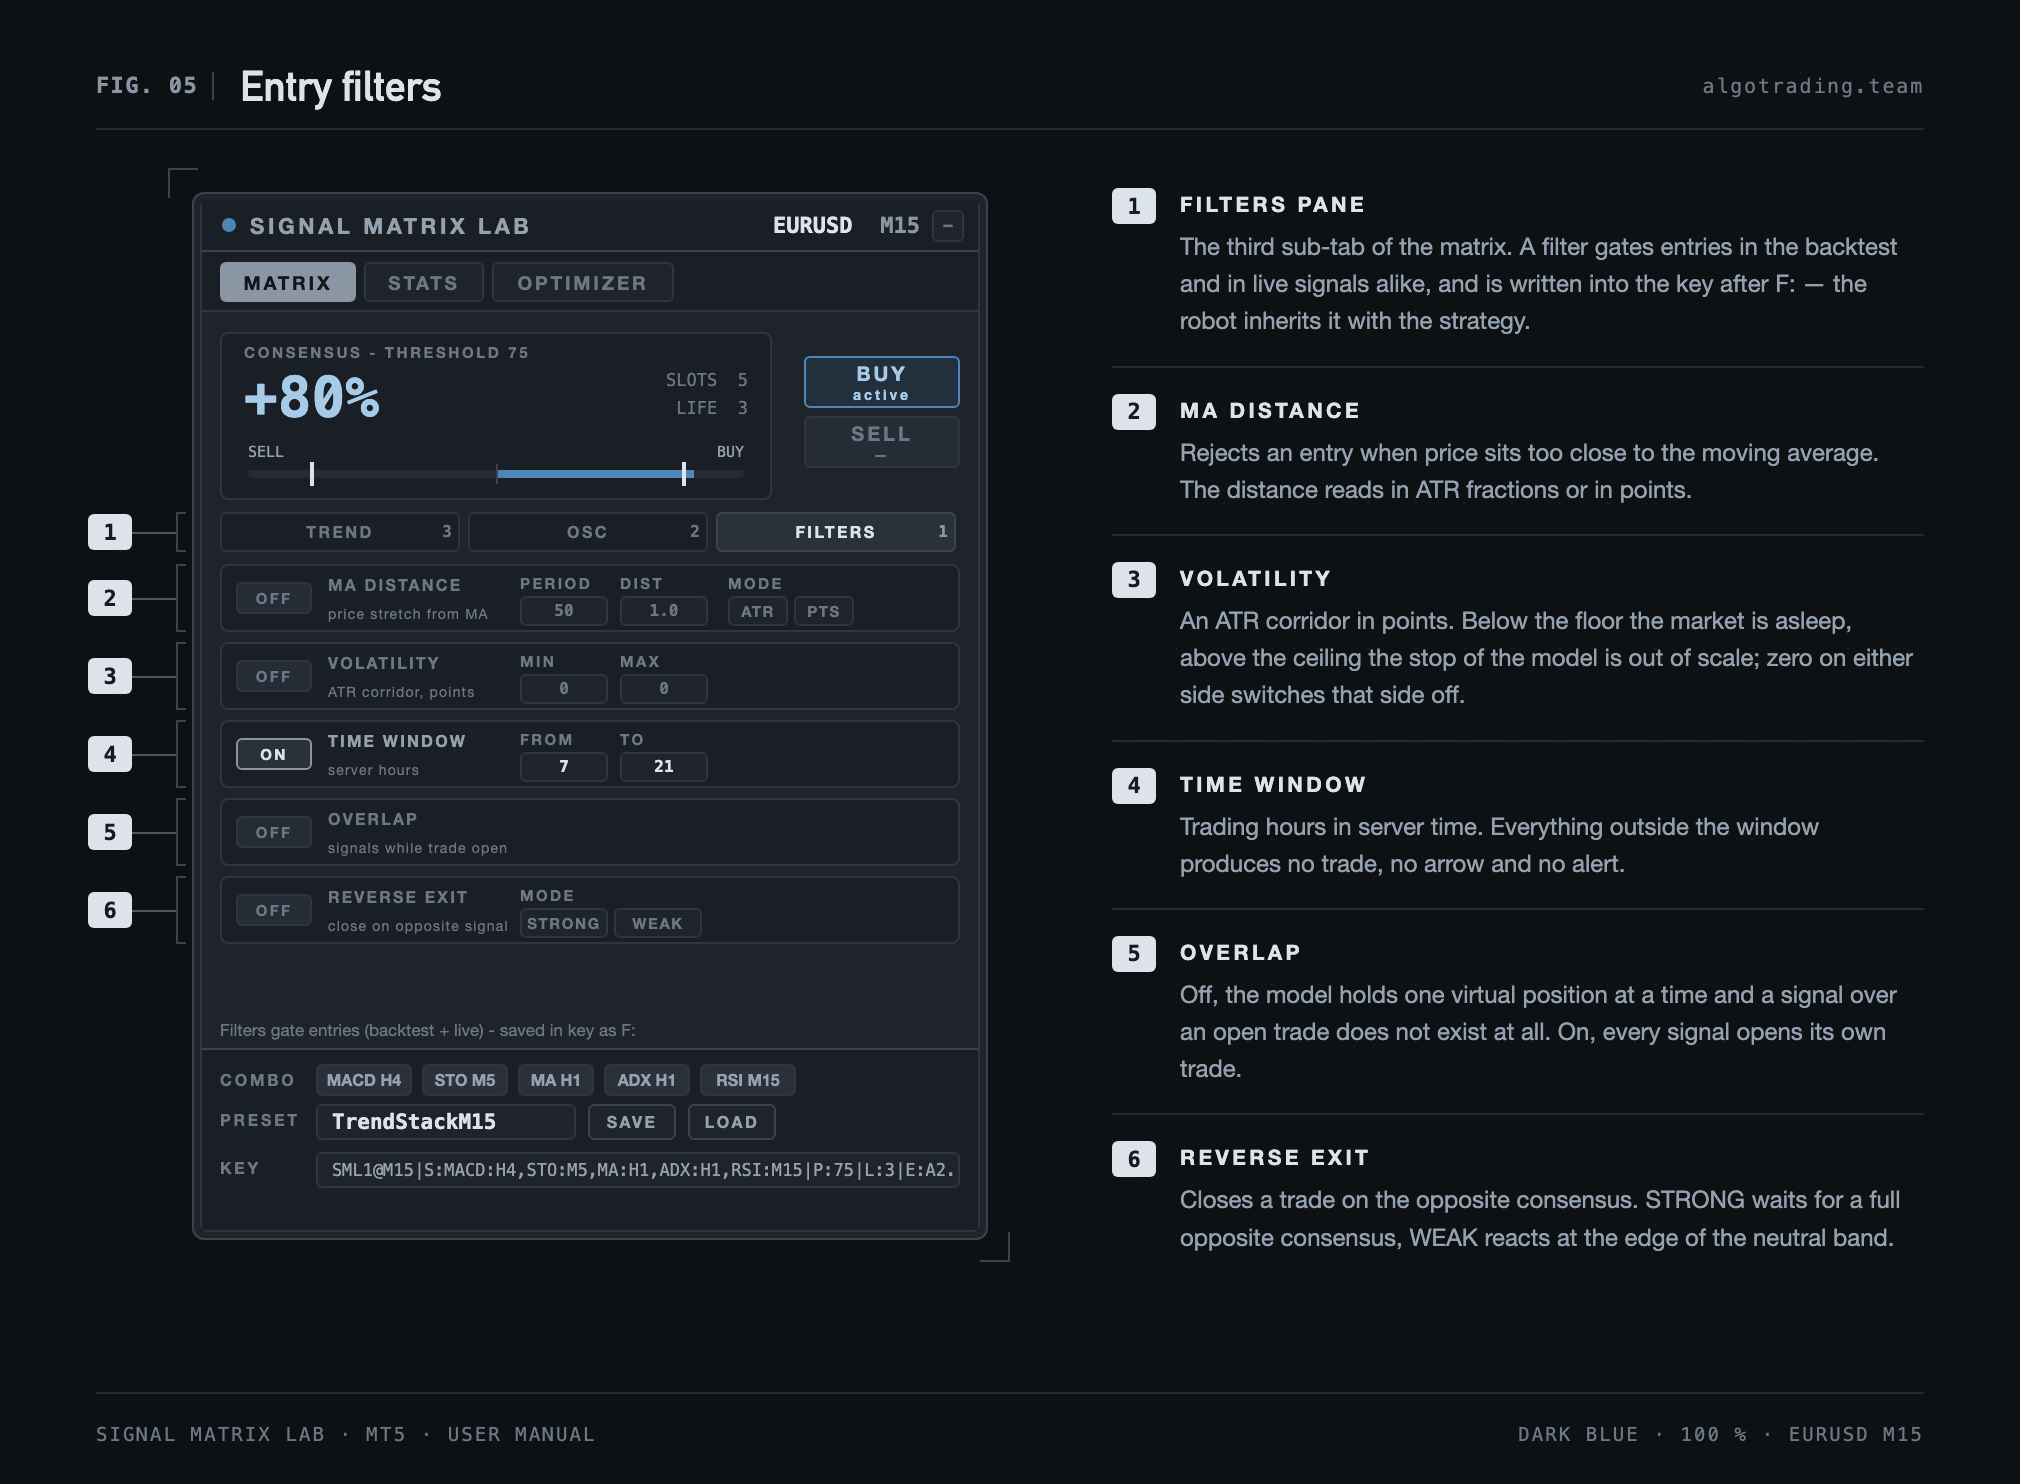
Five switches act the same way on the backtest, on live signals and on alerts, and are written into the key after F: — an Expert Advisor inherits them together with the strategy.
MA distance rejects an entry when price stands too close to the moving average; the distance is read in ATR fractions or in points. Volatility holds an ATR corridor in points: under the floor the market is asleep, over the ceiling the stop of the model loses scale; a zero on either side switches that side off. Time window limits trading hours in server time.
Overlap decides the fate of signals over an open trade. Off, it keeps a single virtual position: a signal that arrives while a trade runs simply does not exist — no arrow, no alert, no trade in the statistics. On, every signal gets its own trade.
Reverse exit closes a trade on the opposite consensus: STRONG waits for a full opposite level, WEAK reacts at the edge of the neutral band.
10. Statistics
Fig. 6. The STATS tab.
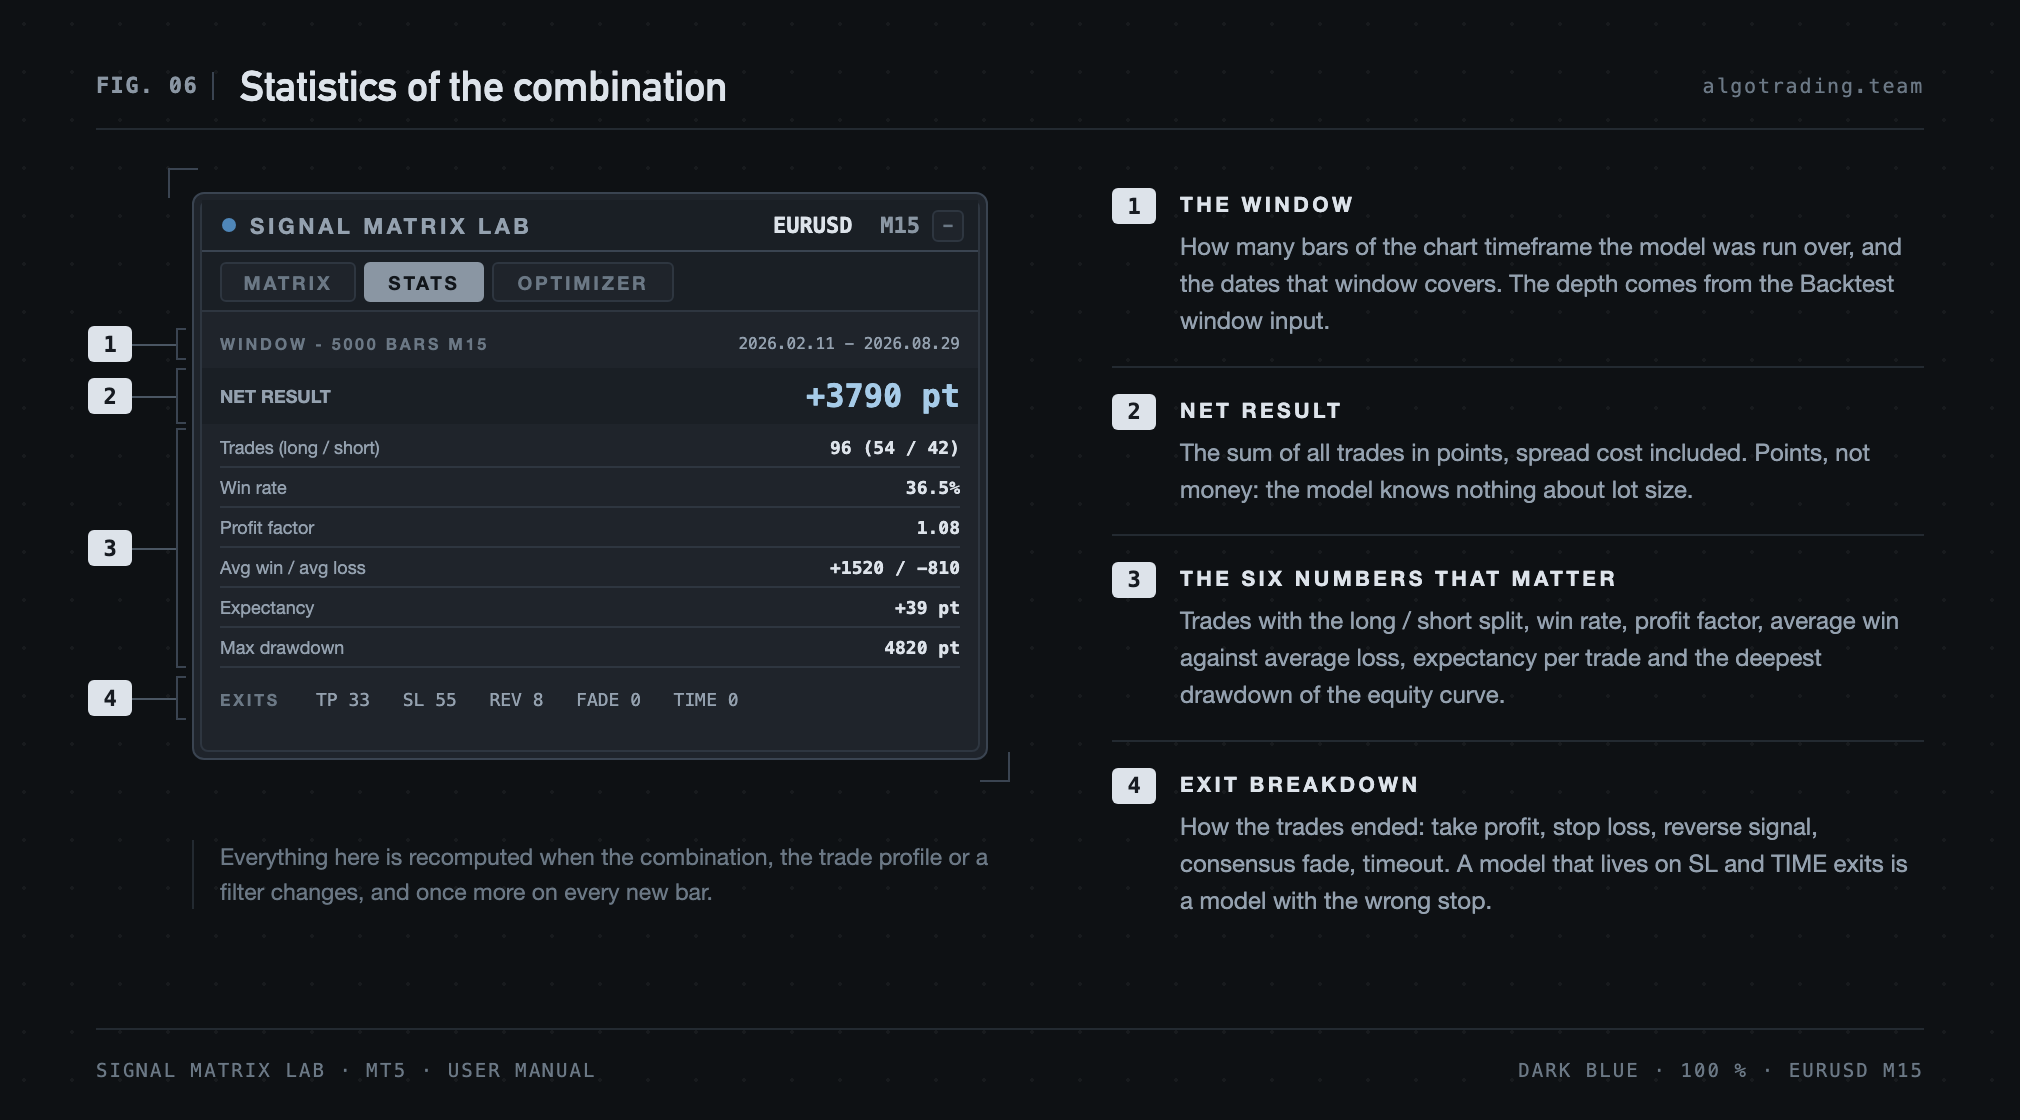
The run covers a window of Backtest window bars of the current timeframe. The net result is counted in points with the spread included — the model knows no money, because it knows no lot size.
Six rows below it: the number of trades split into longs and shorts, the win rate, the profit factor, the average win against the average loss, the expectancy per trade and the deepest drawdown. The breakdown of exit reasons closes the tab. A system that lives on stops and timeouts is a system with the wrong stop, and the breakdown says so earlier than the equity curve does.
Everything is recomputed when the combination, the trade profile or a filter changes, and once more on every new bar.
11. The optimizer
Fig. 7. The OPTIMIZER tab with the pool open.
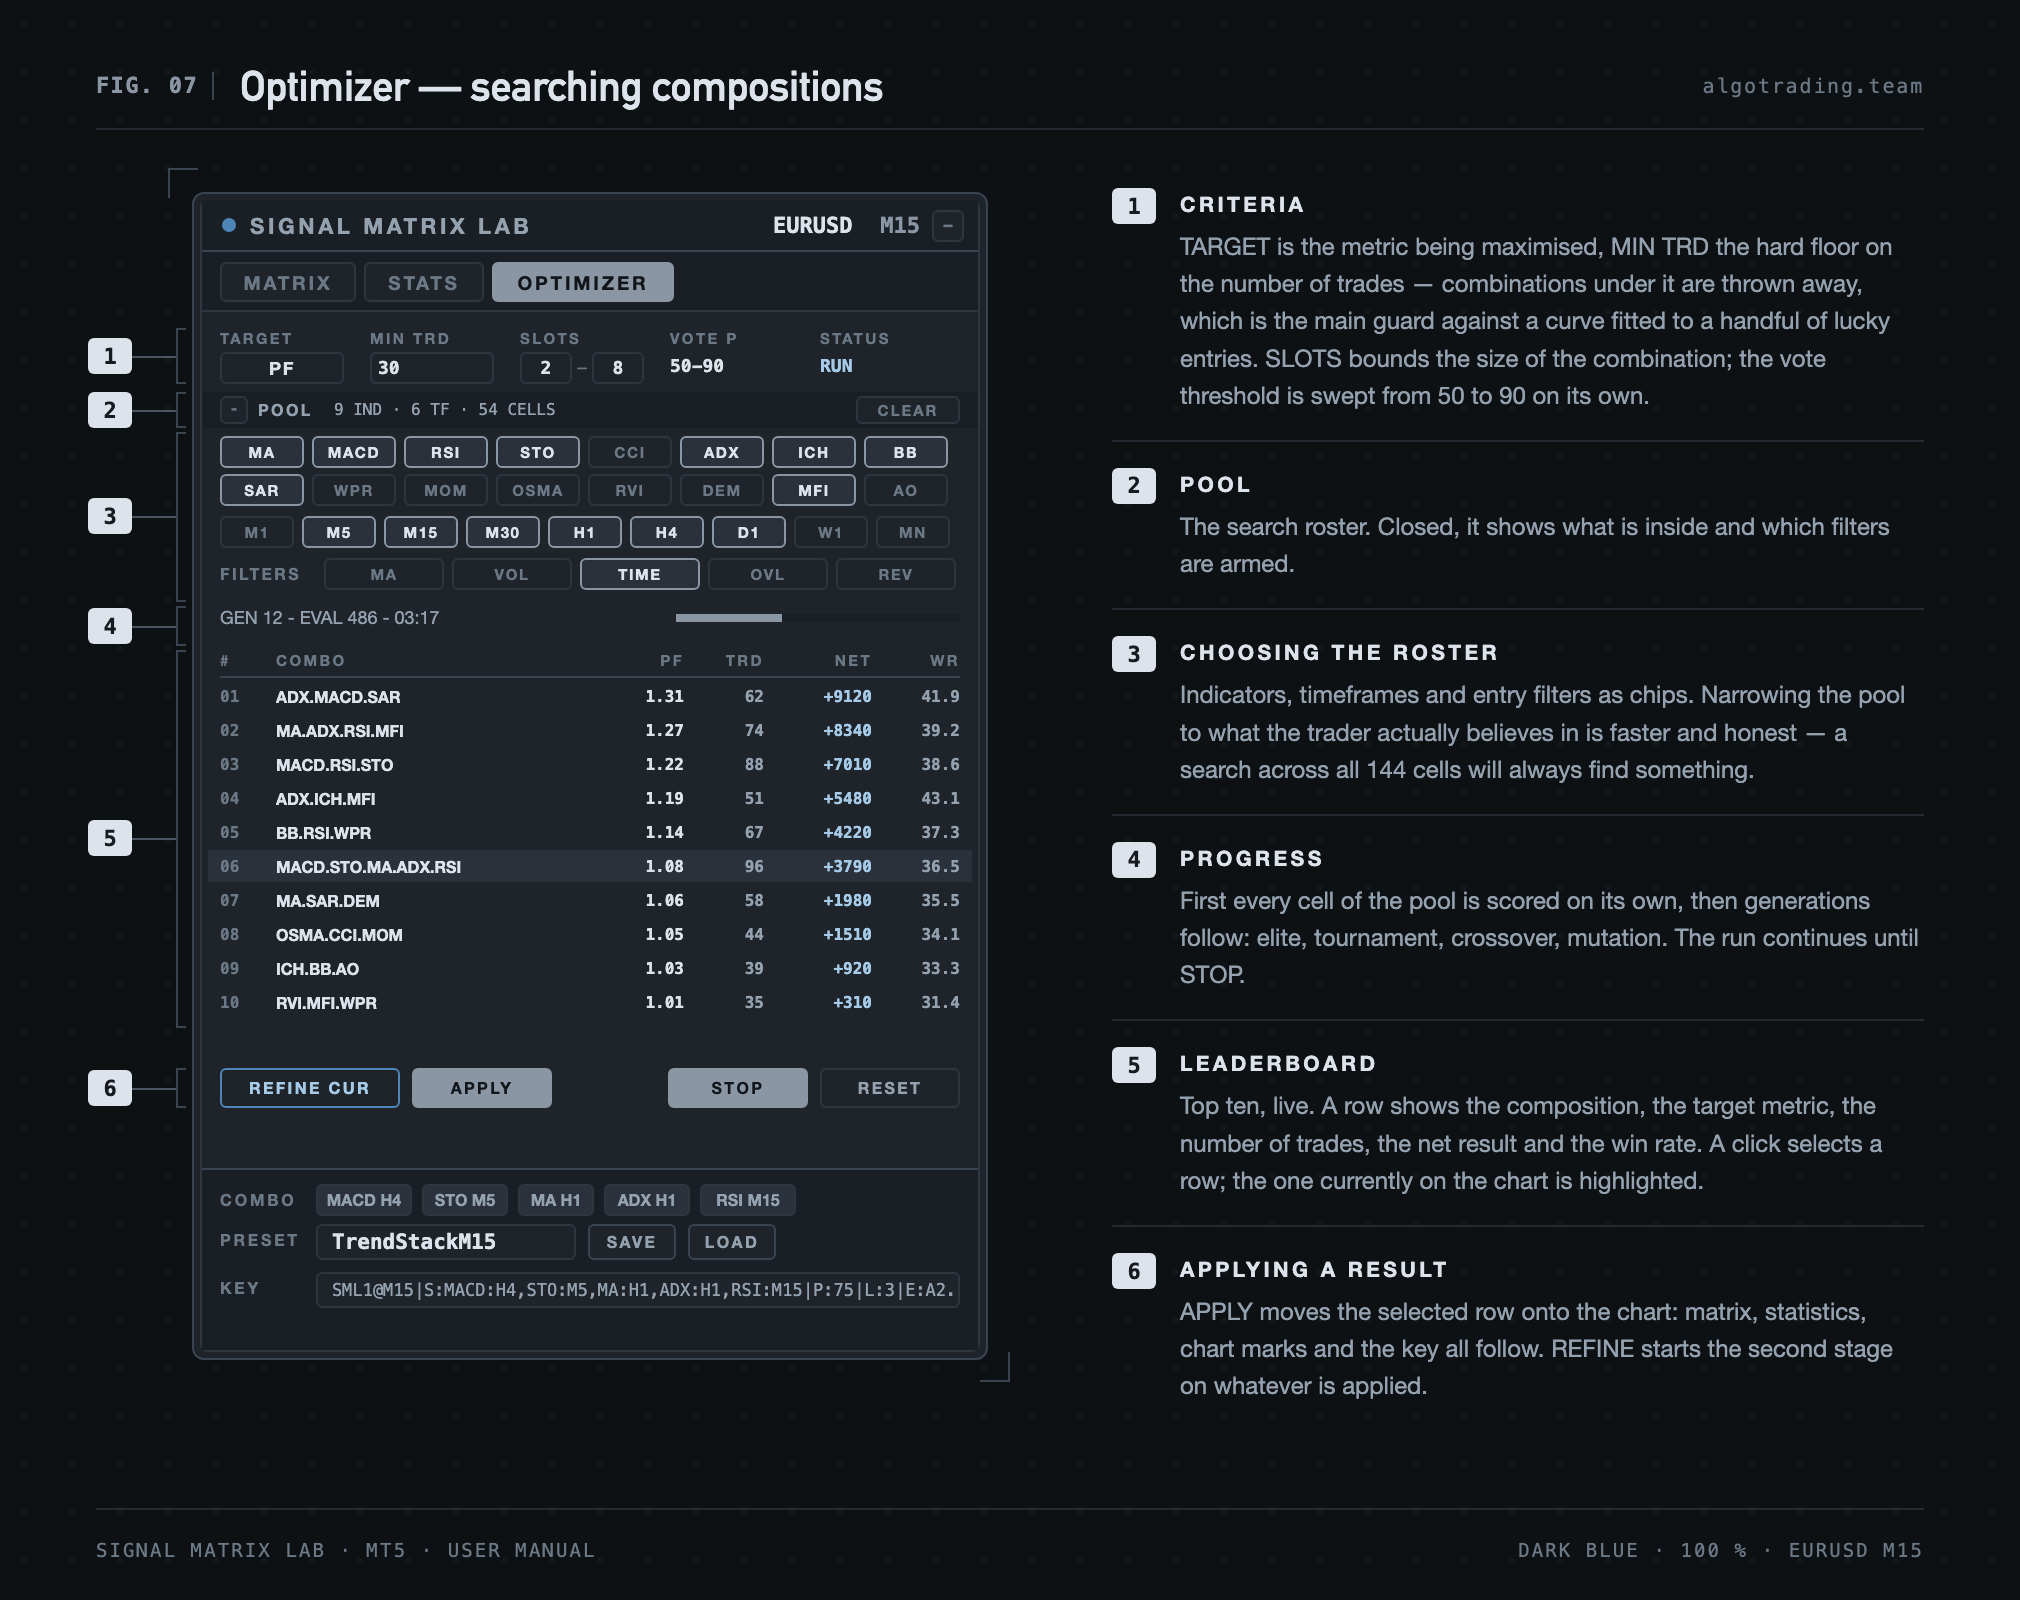
The criteria are edited on the tab itself. TARGET picks the metric being maximised: net result, profit factor, win rate or expectancy. MIN TRD sets a hard floor on the number of trades, and combinations below it are thrown away whole — the main guard against a system fitted to a dozen lucky entries. SLOTS bounds the size of the combination. The vote threshold is swept on its own, from 50 to 90.
POOL is what the search runs over. Collapsed, it states the roster in one line; expanded, it offers chips for indicators, timeframes and filters. Narrowing the pool to what the trader actually believes in is both faster and more honest: a sweep across all 144 cells will always find something.
The search runs in two stages. Every cell of the pool is scored on its own first, then the generations begin — elite, tournament, crossover, mutation. The ten-row leaderboard updates live and keeps going until STOP. A click selects a row, APPLY moves it onto the chart: matrix, statistics, chart marks and key all follow at once. The applied row stays highlighted.
12. Refine — tuning the parameters
Fig. 8. The same screen in Refine mode.
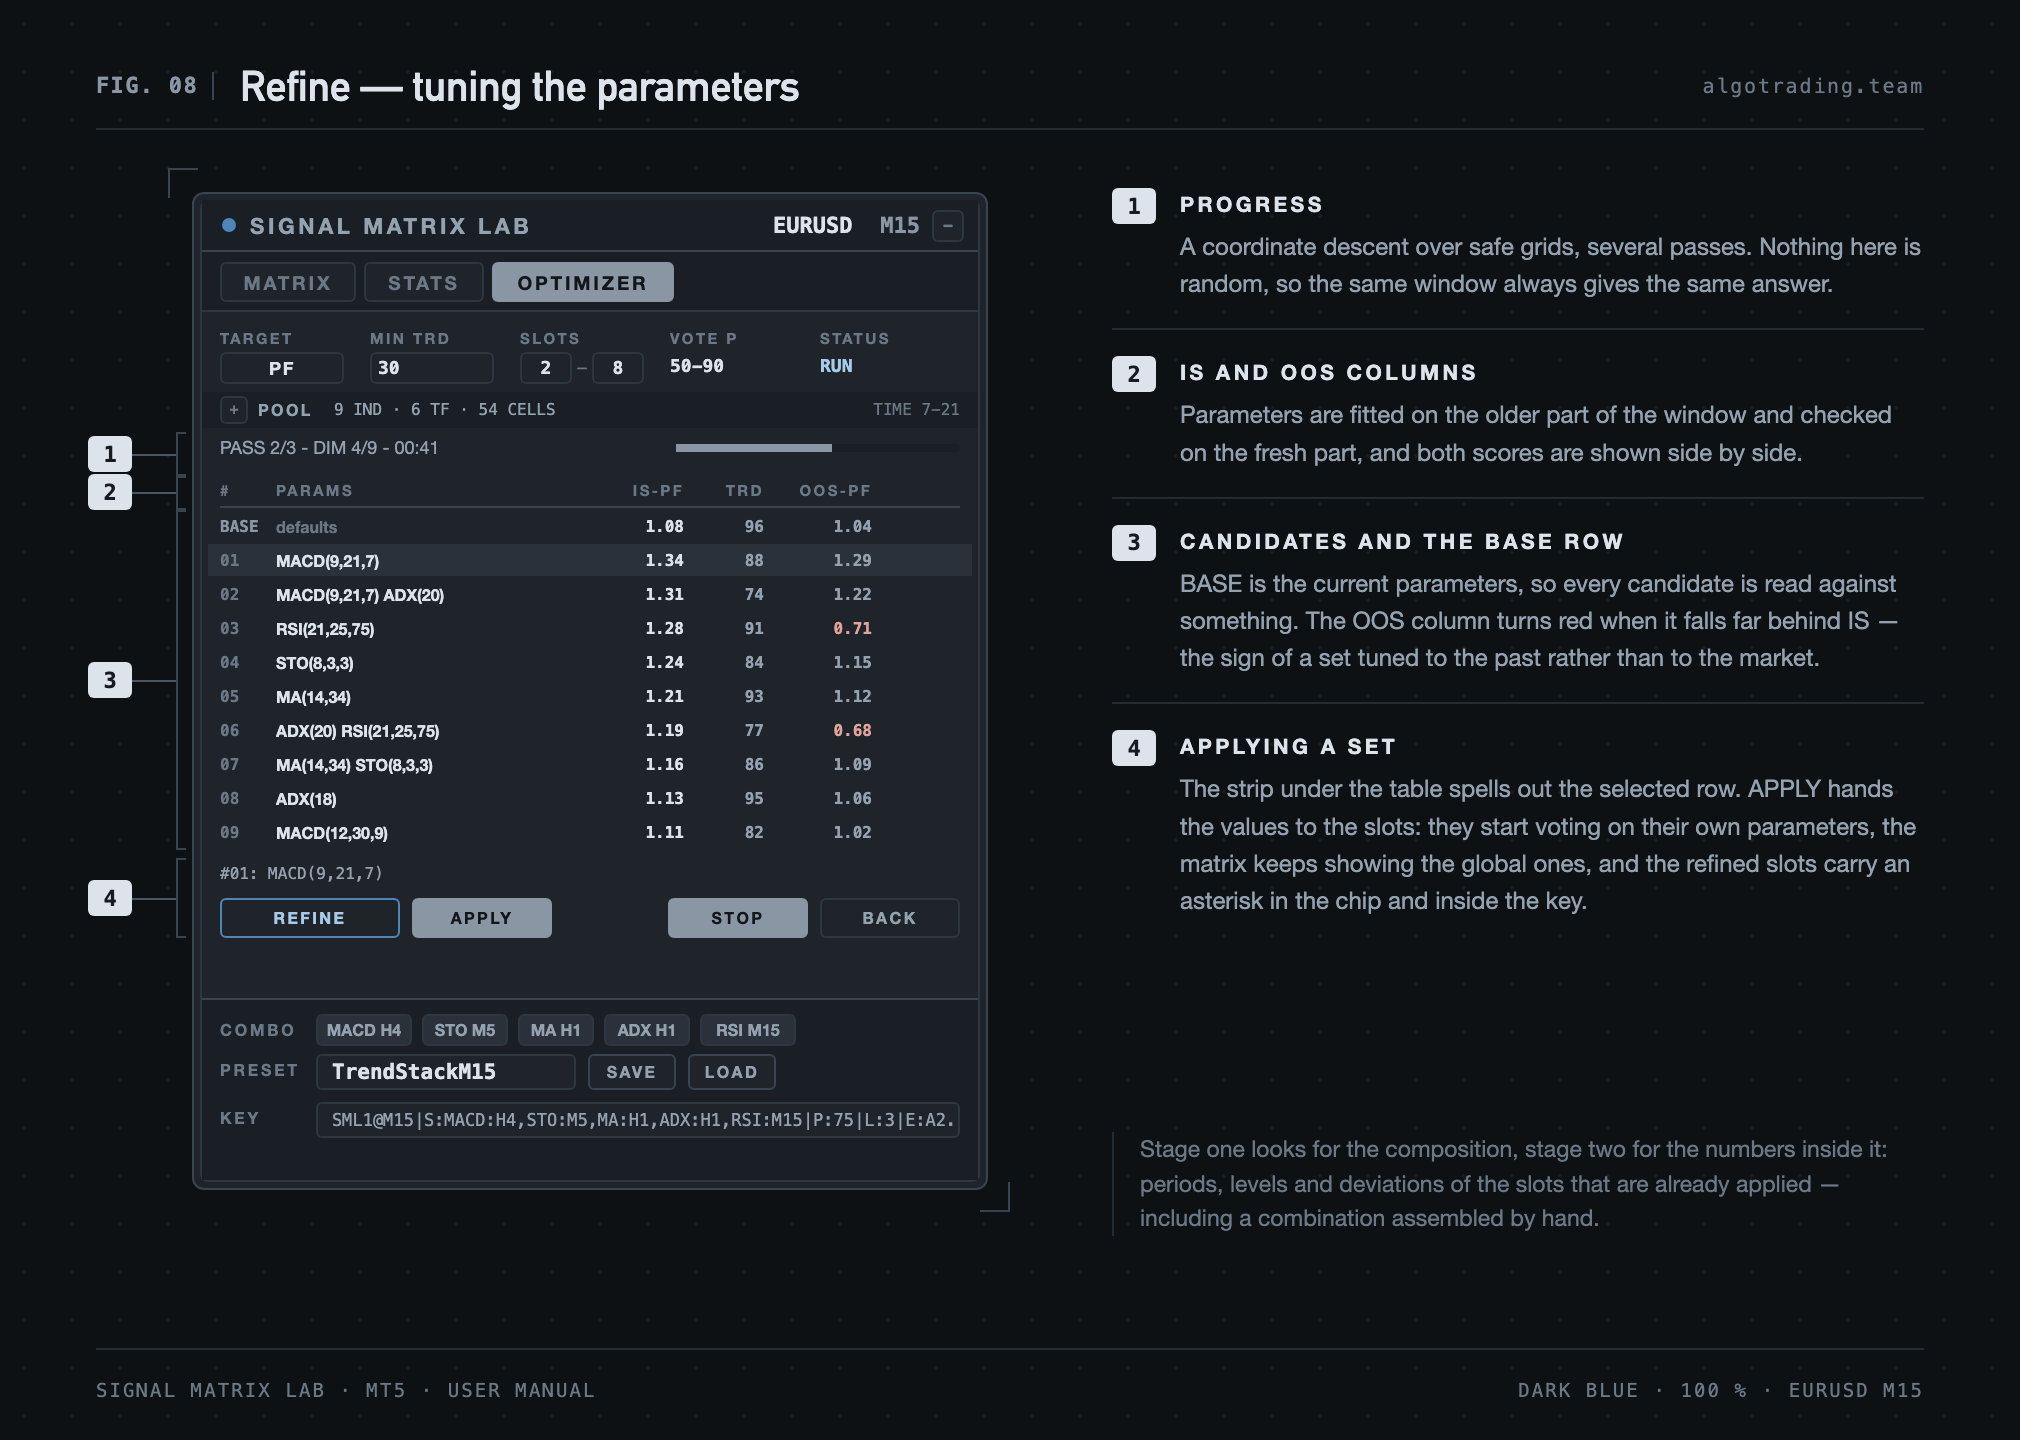
The first stage looks for the composition, the second for the numbers inside it: periods, levels and deviations of the slots that are already applied, including a combination assembled by hand. The method is a coordinate descent over safe grids in several passes; there is nothing random in it, so the same window always gives the same answer.
Two columns matter here. Parameters are fitted on the older part of the window and checked on the fresh part, and both scores stand side by side. When the check falls far behind the fit, the column turns red — the sign of a set tuned to the past rather than to the market. The BASE row holds the current parameters, so every candidate has something to be read against.
APPLY hands the values to the slots: they start voting on their own parameters, the matrix keeps showing the global ones, and the refined slots carry an asterisk in the chip and inside the key.
13. The chart
Fig. 9. Trade marks and signal candles.
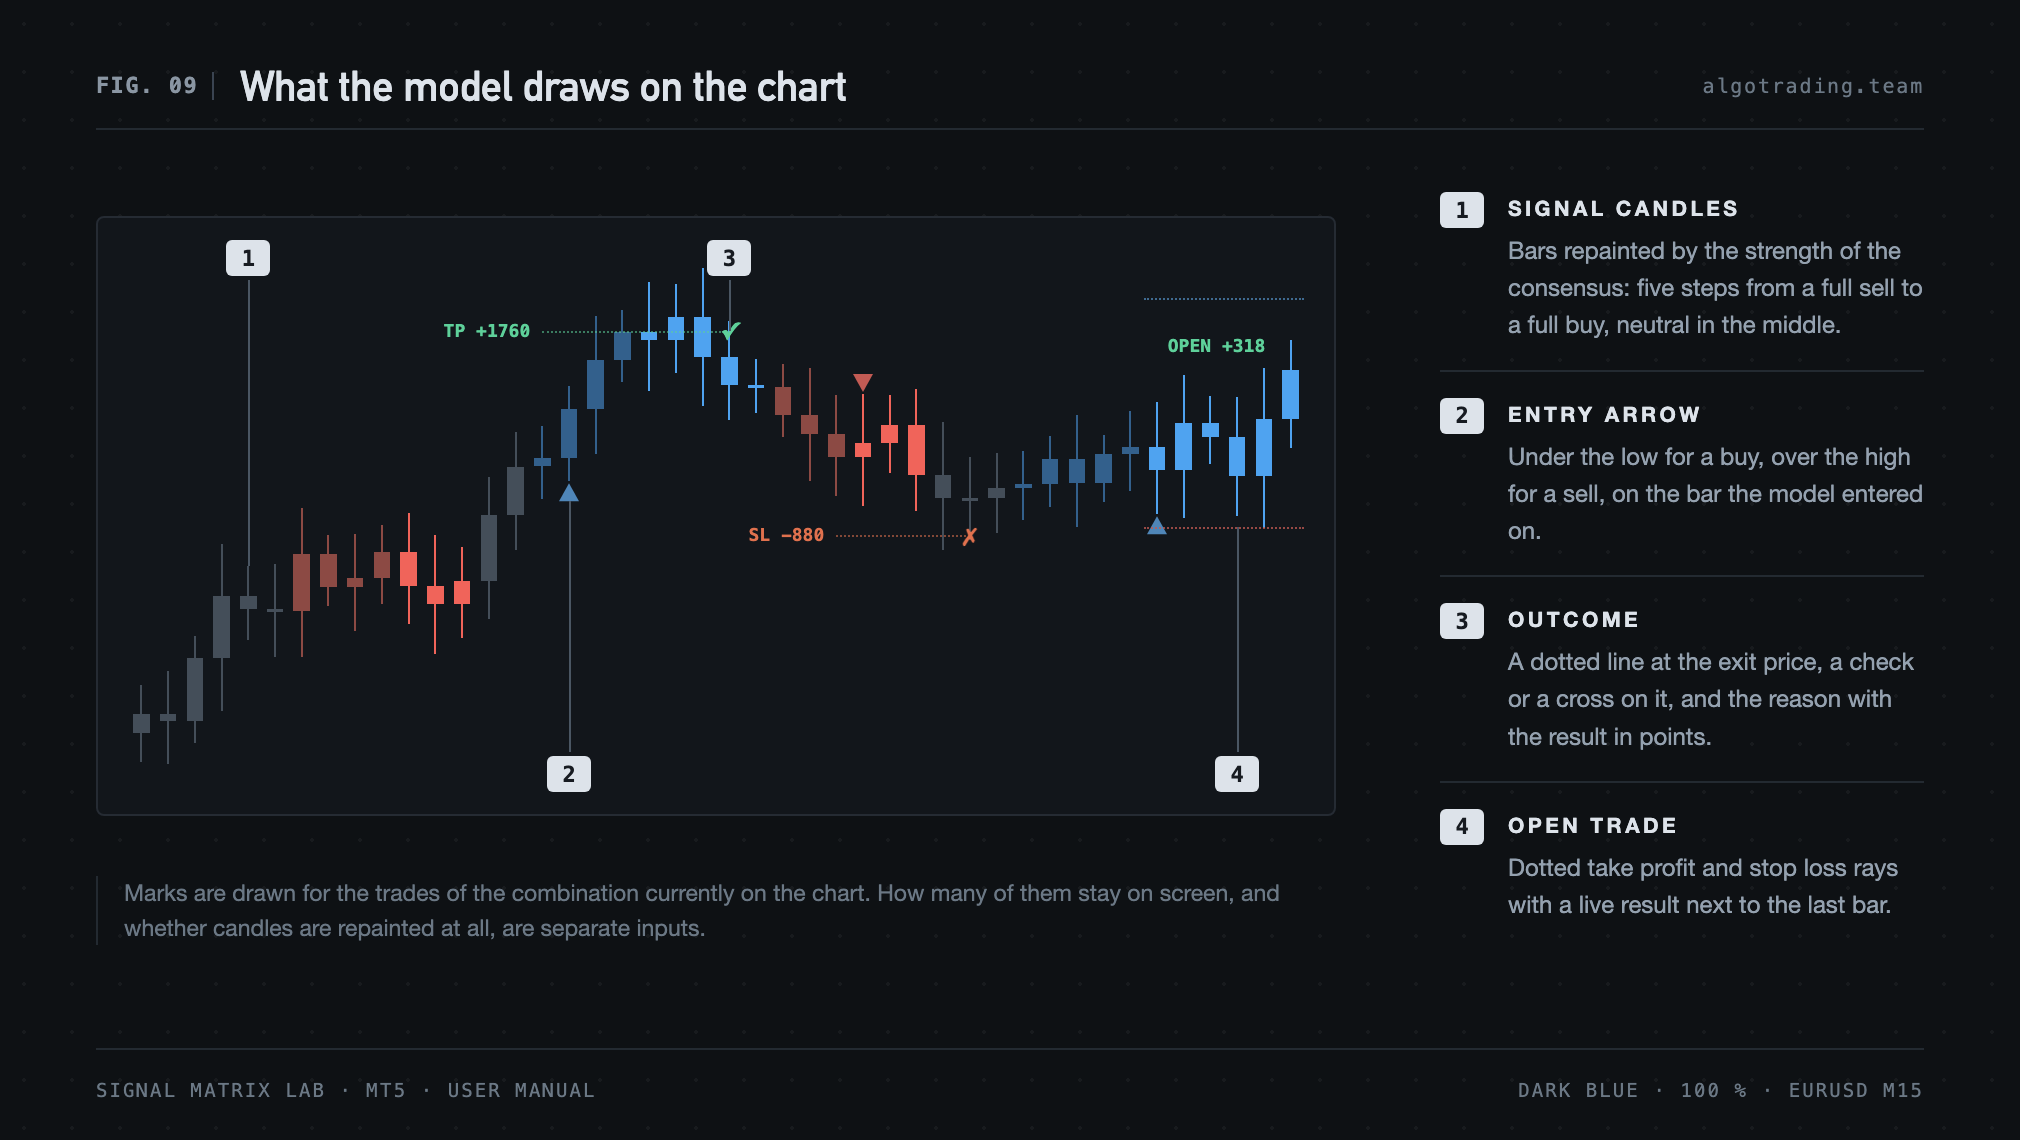
Candles are repainted by the strength of the consensus — five steps from a full sell to a full buy, neutral in the middle. The build-up of a consensus is visible out of the corner of the eye, without reading a single number. Exactly the backtest window is painted: bars older than it keep the native colours of the chart.
Every trade of the model leaves an entry arrow under the low of the bar for a buy and over the high for a sell. The exit is marked by a dotted line at the closing price, a check or a cross on it, and a caption with the reason and the result in points: TP, SL, REV, FADE, TIME. An open trade shows dotted target and stop rays and a live result next to the last bar.
The number of marks kept on screen is limited by Show last N trades; the candle repaint is switched off separately.
14. Keys and presets
A key is the whole strategy on one line:
SML1@M15|S:MACD:H4,STO:M5,MA:H1,ADX:H1,RSI:M15|P:75|L:3|E:A2.0R2.0|F:h7-21
After S: comes the roster of slots, after P: the vote threshold, after L: the signal lifetime, after E: the exit profile (A2.0 is a stop of two ATR, R2.0 a target of twice the risk), after F: the filters. A slot with parameters of its own carries them in brackets: MACD(9,21,7):H4.
The KEY field on the panel is an ordinary input field. The key is copied out of it and pasted anywhere; pasting a key in applies the strategy whole. Parsing is all or nothing: a key with an error changes no setting at all.
SAVE puts the key into the library under the name in the PRESET field, LOAD opens the list of saved ones: a click loads, X deletes. The library lives in the shared sandbox of the terminal, so a preset made on one chart is visible from every other chart and from an Expert Advisor.
15. Alerts
An alert fires on a combination signal, once per bar, and passes the same filters as a trade: if the entry is rejected by time or volatility, there is no sound. The channels are switched on separately: a popup window, a sound with a chosen file, and a push notification to the phone.
16. Strategy mode and the data feed
Fig. 10. The working module and the collapsed strip.
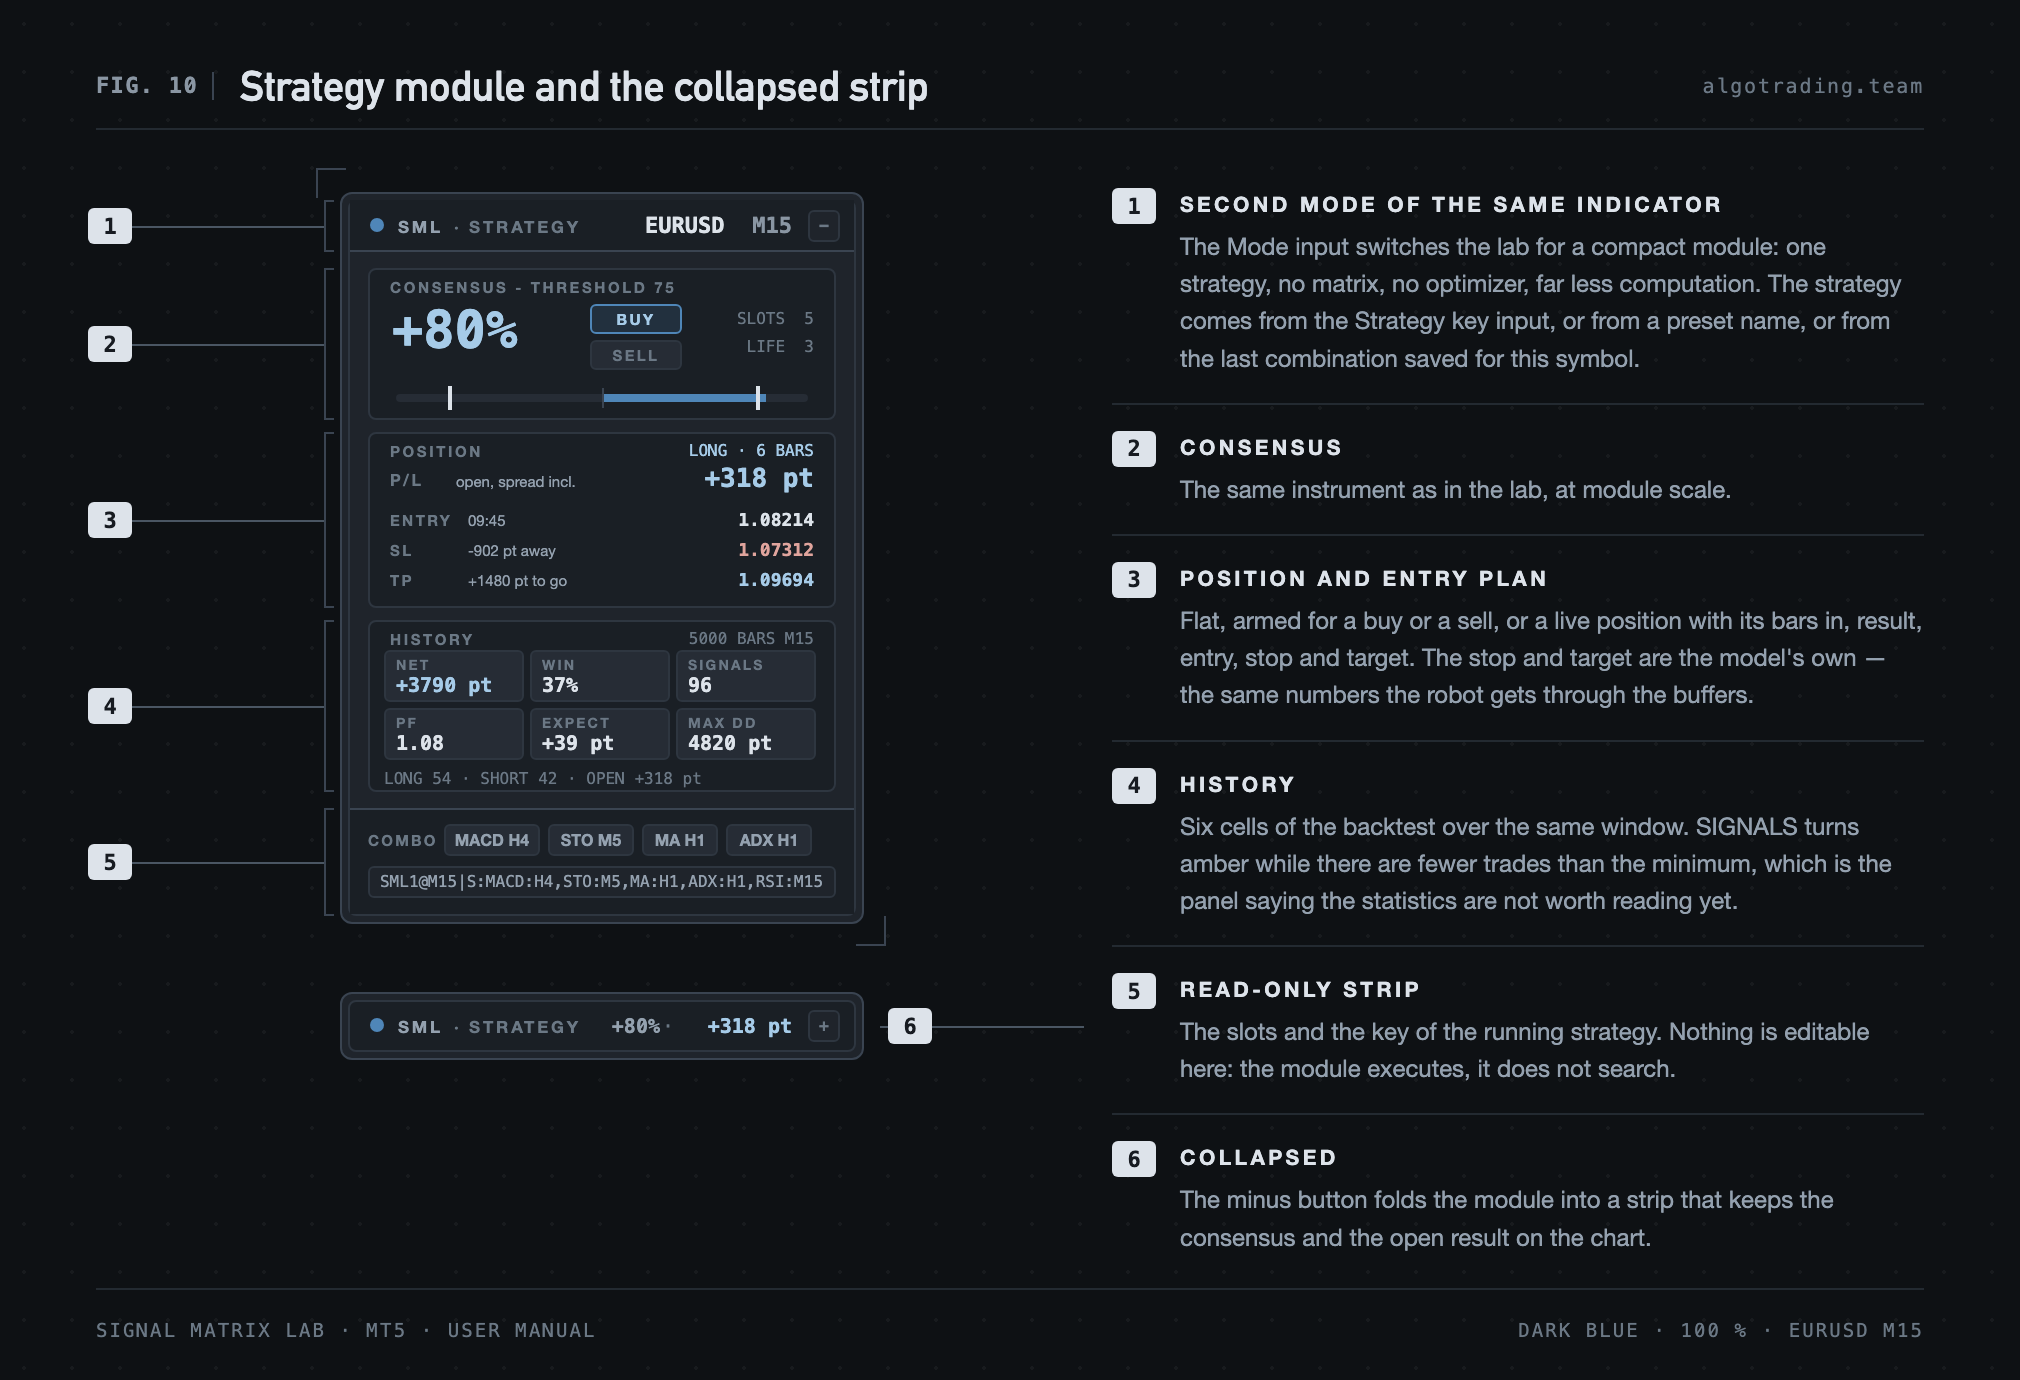 The Mode input switches three states of the same indicator.
Matrix Lab is the full laboratory, everything described above.
Strategy module is a compact module for a single strategy: the consensus, the entry plan or the open position, six numbers of history, and a read-only strip with the roster and the key. There is no matrix, no optimizer and no surplus computation. The strategy comes from the Strategy key input; when it is empty, from a preset by name; when that is empty too, from the last combination saved for this symbol.
EA data feed is the same without a single object on the chart: only the buffers work. That mode is the one meant for a live robot.
The POSITION block shows either FLAT, or FLAT · ARMED BUY when a signal already stands and the entry happens at the open, or the direction and the number of bars in the market for a live trade. The entry, stop and target prices are the ones an Expert Advisor will get.
The SIGNALS cell in the HISTORY block turns amber while there are fewer trades than Minimum trades. That is the panel saying the statistics are not worth reading yet.
17. The bridge to an Expert Advisor
The buffers work in all three modes; the third one is recommended for a robot. The first iCustom parameter is the mode, the second the strategy key, the third a preset name (used when the key is empty).
| Buffer | Content |
|---|---|
| 5 | Entry signal: +1 buy, −1 sell on its own signal bar. Filters already applied |
| 6 | Signed consensus percentage; live on the forming bar |
| 7–16 | Window statistics: trades, win rate, net result, profit factor, expectancy, drawdown, average win, average loss, longs, shorts |
| 17 | Consensus level against the threshold: +1, 0, −1 |
| 18, 19 | Stop and target distances in price on the signal bar |
int h = iCustom(_Symbol, _Period, "SignalMatrixLab",
3, // Mode: EA data feed
"SML1@M15|S:MACD:H4,STO:M5,MA:H1,ADX:H1,RSI:M15|P:75|L:3|E:A2.0R2.0", ""); // or a preset name instead of the key
double sig[1], sl[1], tp[1];
CopyBuffer(h, 5, 1, 1, sig); // signal of the last closed bar
CopyBuffer(h, 18, 1, 1, sl);
CopyBuffer(h, 19, 1, 1, tp);
if(sig[0] != 0)
{
const double entry = SymbolInfoDouble(_Symbol, sig[0] > 0 ? SYMBOL_ASK : SYMBOL_BID);
const double slPrice = entry - sig[0] * sl[0]; // distances are already in price
const double tpPrice = entry + sig[0] * tp[0];
// ... send the order }
The stop and the target come as distances rather than prices because the model enters at the open of the next bar: an Expert Advisor offsets them from its own actual entry and keeps parity with the backtest.
18. Inputs
| Group | What it sets |
|---|---|
| Mode | Working mode, strategy key, preset name |
| General | Colour scheme (Dark Blue, Dark Green, Light), panel size, font and font size, digit font, panel position in X and Y |
| Matrix | Focus mode, visibility of every row and every column |
| Voting | Consensus threshold in percent |
| Signals | Lifetime of a cell signal in bars of its own timeframe |
| Indicator groups | Periods, levels and deviations of all sixteen: MA, MACD, RSI, Stochastic, CCI, ADX, Ichimoku, Bollinger, SAR, Williams %R, Momentum, OsMA, RVI, DeMarker, MFI. The same values are edited from the panel |
| Trade Profile | Stop mode with the ATR factor or fixed points, ATR period, target mode with the risk ratio or fixed points, the three early exits, the spread cost |
| Filters | Starting state of the five filters and their values |
| Trade Marks | Trades on the chart, number of recent marks |
| Signal Candles | Repainting candles by consensus strength |
| Stats | Depth of the backtest window in bars |
| Optimizer | Target metric, minimum trades, bounds on the combination size, population size |
| Refine | Validation on fresh data, its share of the window, the number of passes |
| Alerts | Alerts on and the channels: popup, sound with a file name, push |
Input values are the starting point. Whatever is edited on the panel lives in the state file of the symbol and takes priority until the inputs themselves are changed; changing an input resets the matching value to the new one.
19. Files
The preset library is Common\Files\SignalMatrixLab\Presets.csv, one for every terminal and chart. The symbol state is MQL5\Files\SignalMatrixLab\<symbol>.txt: the combination, the threshold, the exit profile, the filters, the indicator parameters, the panel position, the active tab and whether it is folded.
Deleting the state file returns the symbol to the input values. Deleting the preset file clears the library.
20. When something looks wrong
Some cells are empty. The broker has no history of that timeframe for the whole window. It is not an error: a cell without data votes in neither direction. A shorter backtest window, or hiding the highest columns, resolves it.
SIGNALS is amber. There are fewer trades than Minimum trades. The statistics are computed but too thin to argue with: a longer window, softer filters or a simpler combination helps.
The optimizer found something too good. Refine and its validation column are the place to look: a high fit with a sunken check is overfitting. The second sign is a small number of trades under a high profit factor.
There is a signal on the chart but no trade in the statistics. Most likely the entry was rejected by a filter, or Overlap is off and a virtual trade was already running at that moment.
The panel is too small or too large. The Auto size follows the screen; XS, S, M and L are set by hand.
21. Limitations
The indicator does not trade and sends no orders. The statistics follow a model: entry at the open of the next bar, stop and target inside the bar, spread taken from an input, slippage and commission not counted. Results are expressed in points, not in money.
The depth of the calculation is bounded by the history the broker serves and by the backtest window. The optimizer and Refine run while the chart is open and their state is not carried between sessions — what is carried is the result applied to the chart, and the presets.
The interface is in English. In the strategy tester the indicator loads and computes, but the panel there is driven by a mouse the tester does not have.