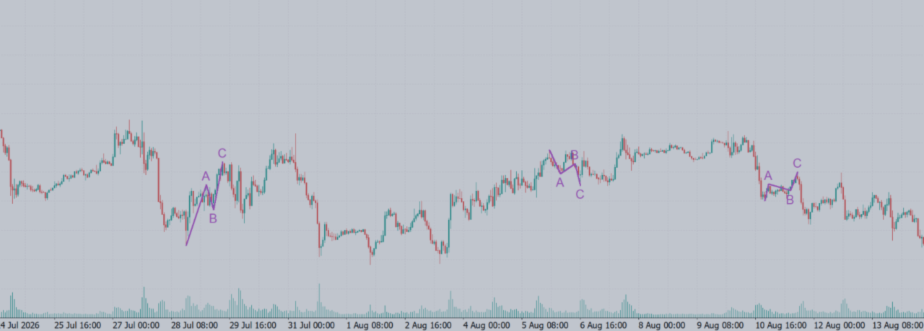
How to Identify Elliott Wave ABC Corrections Across Multiple Scales in MT5
31 August 2026, 15:37

0
16
A practical explanation of why small, medium and large ABC corrections can appear on the same chart, how A=C proportionality can help filter them, and why confirmation matters.
The Fractal Nature of Elliott Wave Corrections
One of the most important ideas in Elliott Wave analysis is that market structure is fractal. A corrective pattern visible on a five-minute chart may contain several smaller corrections, while the complete structure may itself be only one part of a larger correction.
This creates a practical problem. When traders analyse only one structural degree, they may overlook useful information that is already visible on the same chart. A small ABC correction can develop inside a medium ABC correction, and both can appear inside a much larger market swing.
The timeframe has not changed. Only the scale of observation has changed.
What Is an ABC Correction?
An ABC correction is commonly described as three price movements:
A: the first corrective movement away from the preceding trend or swing.
B: a partial retracement of wave A.
C: a second movement in the direction of wave A.
The labels describe market structure; they do not automatically create a trading signal. Context remains important. Trend direction, support and resistance, momentum, alternation and the surrounding Elliott Wave count should still be considered.
Why the A=C Relationship Matters
Wave C often develops a proportional relationship with wave A. Equality between A and C is one of the best-known Elliott Wave guidelines, although it is not an absolute rule.
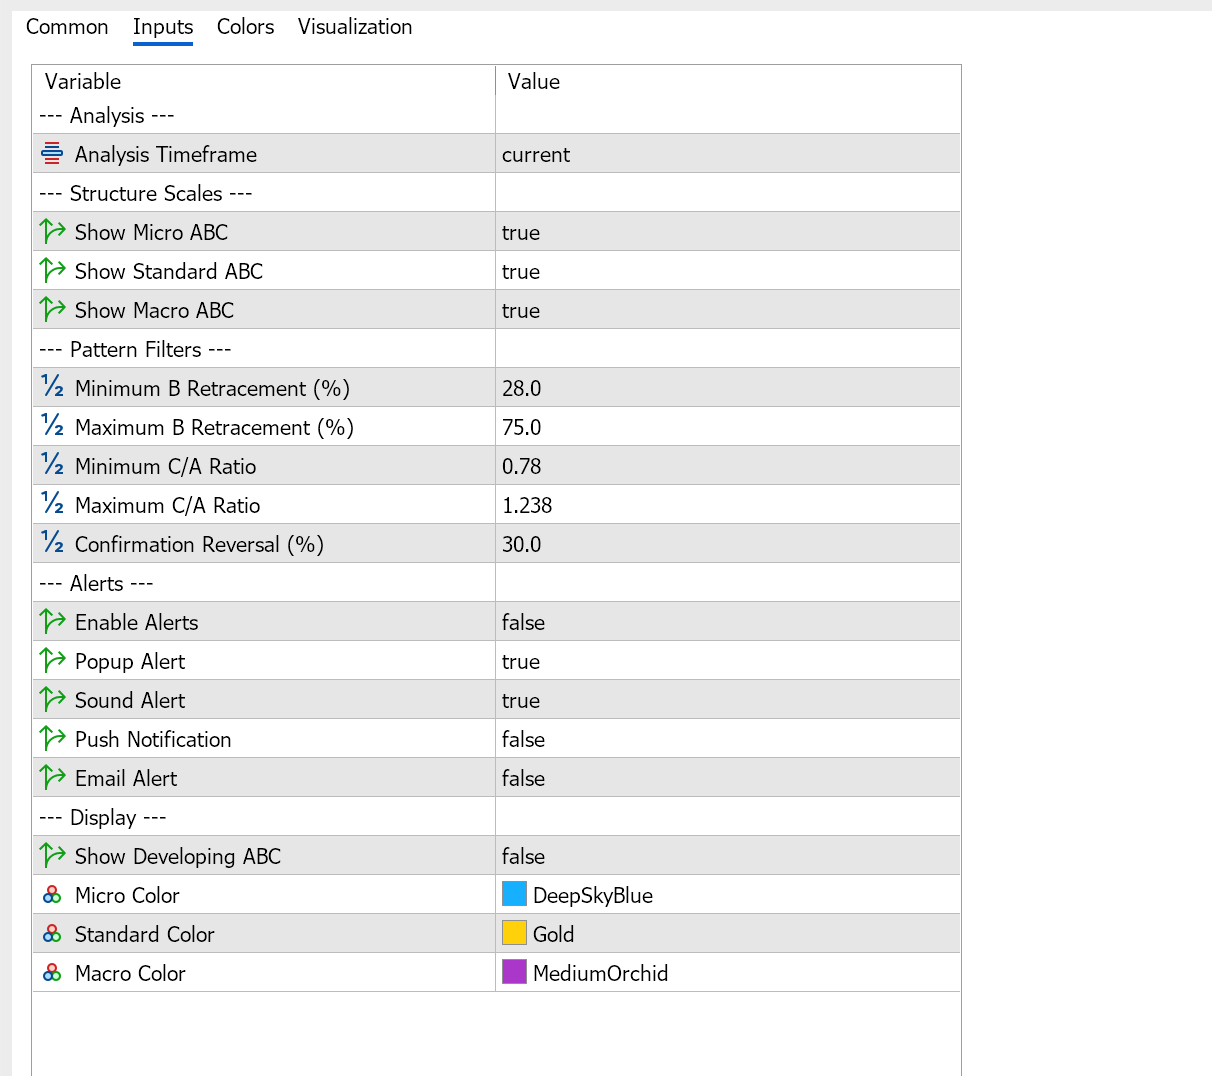
For practical detection, it is usually better to use a proportional range rather than demand perfect mathematical equality. The default settings of TM Elliott Wave Zigzag Multi Scale accept a C-to-A ratio between 0.780 and 1.238. This allows the indicator to recognise structures that are reasonably close to A=C without requiring an exact match that markets rarely produce.
The default B-wave filter accepts a retracement between 28% and 75% of wave A. These values are adjustable filters used by the indicator. They should not be interpreted as universal Elliott Wave rules.
Why Several ABC Patterns Appear on One Timeframe
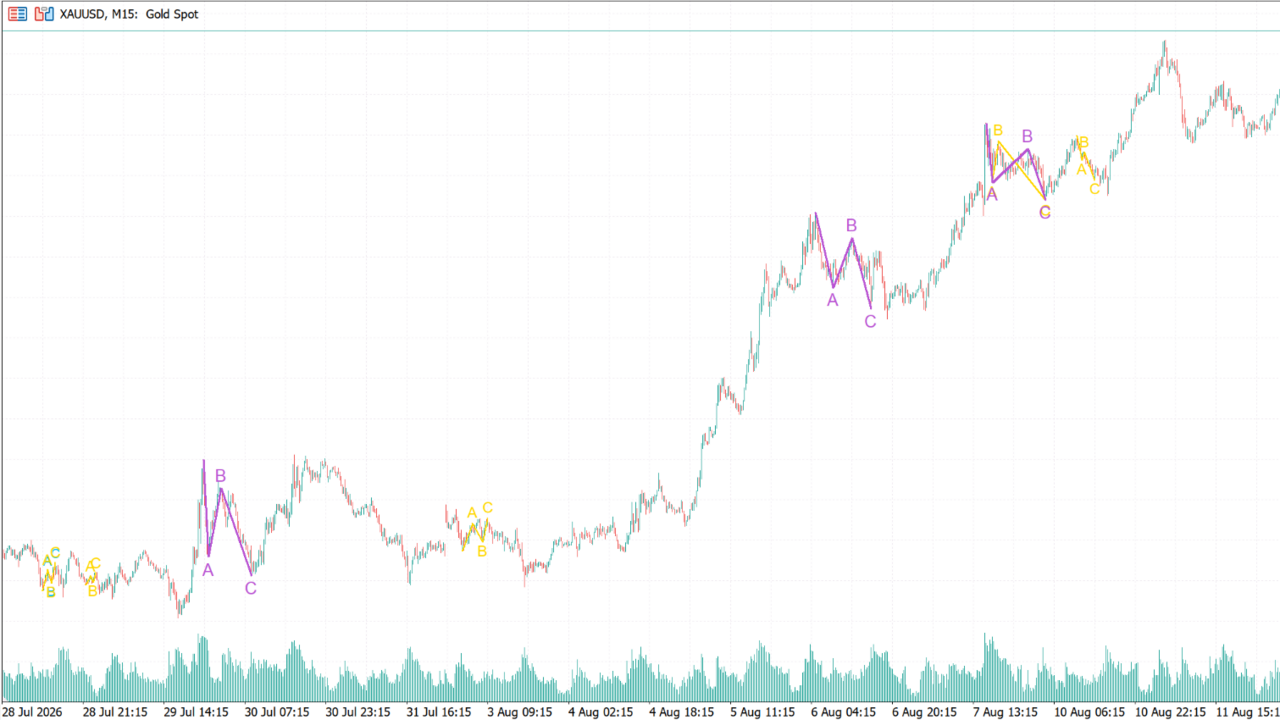
Suppose a trader is studying XAUUSD on a 15-minute chart.
A short correction lasting a few candles may form a Micro ABC. A broader correction covering a larger section of the same chart may form a Standard ABC. A still larger structure, containing both smaller patterns, may form a Macro ABC.
All three structures are produced from the same price data. The difference comes from the sensitivity used to confirm meaningful turning points.
This is why changing the timeframe is not the only way to study different Elliott Wave degrees. Multiple degrees can coexist and remain visible on one chart.
Three Structural Scales
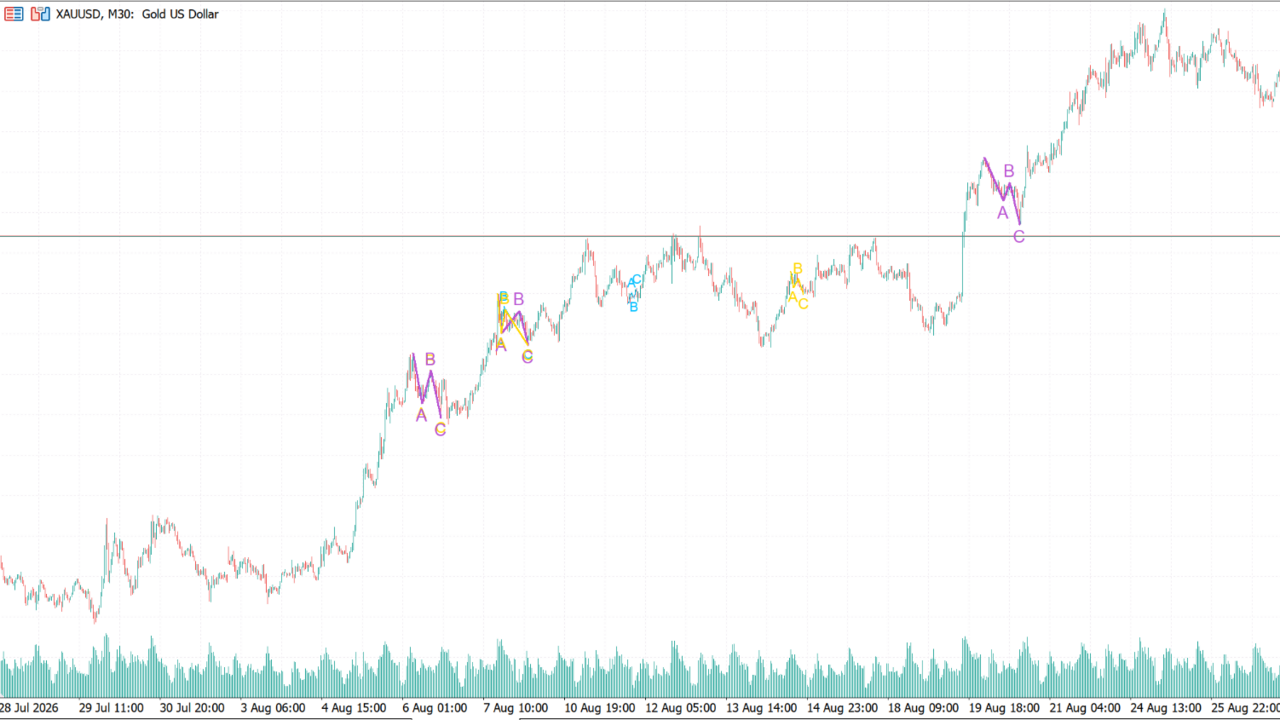
TM Elliott Wave Zigzag Multi Scale separates potential corrective structures into three visual scales:
Micro ABC uses the highest sensitivity and identifies smaller corrective structures.
Standard ABC focuses on intermediate structures and provides a balance between detail and chart clarity.
Macro ABC uses wider turning-point confirmation and highlights larger corrective structures.
The default colours are:
Micro: DeepSkyBlue
Standard: Gold
Macro: MediumOrchid
The line thickness also increases with scale. This allows a trader to distinguish structural degree without adding long descriptions to the chart.
How Pattern Confirmation Works
A developing Zigzag structure can change while price is still extending. For this reason, the indicator separates a possible developing ABC from a confirmed completed structure.
First, wave C must enter the selected C-to-A proportional range. The structure then remains live because price can continue extending wave C. With the default settings, the pattern is locked only after price reverses by 30% of the total movement from the beginning of A to the C extreme.
This confirmation creates a deliberate delay. The purpose is not to mark the exact turning tick. The purpose is to reduce premature completion labels while wave C is still developing.
Completed patterns are drawn with solid lines. When Show Developing ABC is enabled, active structures are drawn with dotted lines. Developing structures may move, rebuild or disappear as new price data changes their geometry. A completed structure is displayed only after the selected reversal confirmation has occurred.
Using the Indicator in MT5
1. Apply TM Elliott Wave Zigzag Multi Scale to an MT5 chart.
2. Keep Analysis Timeframe set to Current if you want the indicator to analyse the open chart timeframe.
3. Enable Micro, Standard and Macro ABC to compare all three structural degrees.
4. Keep Show Developing ABC disabled when you want the cleanest chart containing only confirmed structures.
5. Enable alerts only when you want notifications for qualifying ABC developments or confirmations.
How to Interpret the Display
The indicator is most useful as a structural map, not as an automatic instruction to buy or sell.
A Micro ABC may help a short-term trader study the internal behaviour of a larger swing. A Standard ABC may show the main correction currently visible on the chart. A Macro ABC may provide context for the broader movement and help prevent a small pattern from being mistaken for the dominant structure.
Confluence can make the observation more meaningful. Traders may compare an ABC structure with:
Support and resistance
Trend channels
Momentum divergence
Fibonacci relationships
The larger Elliott Wave count
The indicator performs the repetitive geometric work. The trader remains responsible for interpreting the wider market context.
Important Limitations
No Zigzag-based pattern tool can know the final turning point before the market confirms it. Developing structures are dynamic by nature.
An identified ABC does not guarantee a reversal, a profitable trade or a complete Elliott Wave count. The pattern may be part of a more complex correction, and different analysts may assign different wave degrees to the same movement.
The indicator should therefore be used for analysis, education and structural observation. Risk management and independent confirmation remain essential.
Conclusion
The main advantage of multi-scale analysis is perspective. Instead of forcing every price movement into one structural degree, traders can observe small, medium and large ABC corrections simultaneously.
This makes the fractal character of Elliott Wave analysis easier to study and helps organise a chart without covering it with excessive commentary.
TM Elliott Wave Zigzag Multi Scale is available free for MetaTrader 5:
[INSERT PRODUCT LINK]
https://www.mql5.com/en/market/product/193384
https://www.mql5.com/en/market/product/193384
The indicator is an analytical tool. It does not open trades and does not guarantee future market results.
RECOMMENDED TAGS
Elliott Wave, ABC correction, A equals C, Zigzag indicator, MetaTrader 5, MT5 indicator, market structure, technical analysis, multi scale analysis