
#1: When average is not enough. A new approach to gold night trading
#2: The DNA of a night system. Philosophy before performance - Trading Systems - 15 June 2026 - Traders' Blogs
#3: The numbers. Six years of gold, two risk profiles Part 01 - Trading Systems - 24 June 2026 - Traders' Blogs
#4: One system, three brokers. Backtesting, Part 02 - Trading Systems - 29 June 2026 - Traders' Blogs
#5: Three weeks live. A short status report - Trading Systems - 12 July 2026 - Traders' Blogs
System: NightScalper — Project #1 (XAUUSD). Part 6 of the launch series — August release.
Live Signal: https://www.mql5.com/en/signals/2379124
It has been a while since the last update. That silence was deliberate, and this post explains why.
Why I waited
A backtest can tell you how a system behaved through past trend changes. A three-week live sample cannot tell you much of anything. What I wanted was the thing in between: to watch the system handle a real trend change, live, on the daily timeframe — and to see whether it did what the backtest said it would.
So instead of publishing on schedule, I waited for the market to hand me that test. It did. Gold shifted direction, and I got to watch the transition happen with real money on the line rather than in a report.
I can report that it passed — and it passed in the way I most wanted to see.
What it actually did: mostly nothing
Here is the part worth understanding.
During the critical phase where the trend flipped from short to long, the system did not trade. Not because it failed to notice — because the signals were not unambiguous. When the picture was mixed, it stood aside. That is exactly the behaviour #2 described as the DNA of the system: patience and selectivity, the willingness to do nothing when nothing is clearly worth doing.
The cost of that was real and worth stating plainly: for several weeks, the system simply did not trade. No new positions, a flat curve, nothing to show. For an owner watching an account, that is its own kind of test — the temptation to "fix" a system that is quietly waiting is strong, and giving in to it is how good systems get ruined.
I did not touch it. And once the new direction resolved and the signals lined up, it joined the move — without straining the drawdown in any meaningful way. It came through the turn intact.
The numbers
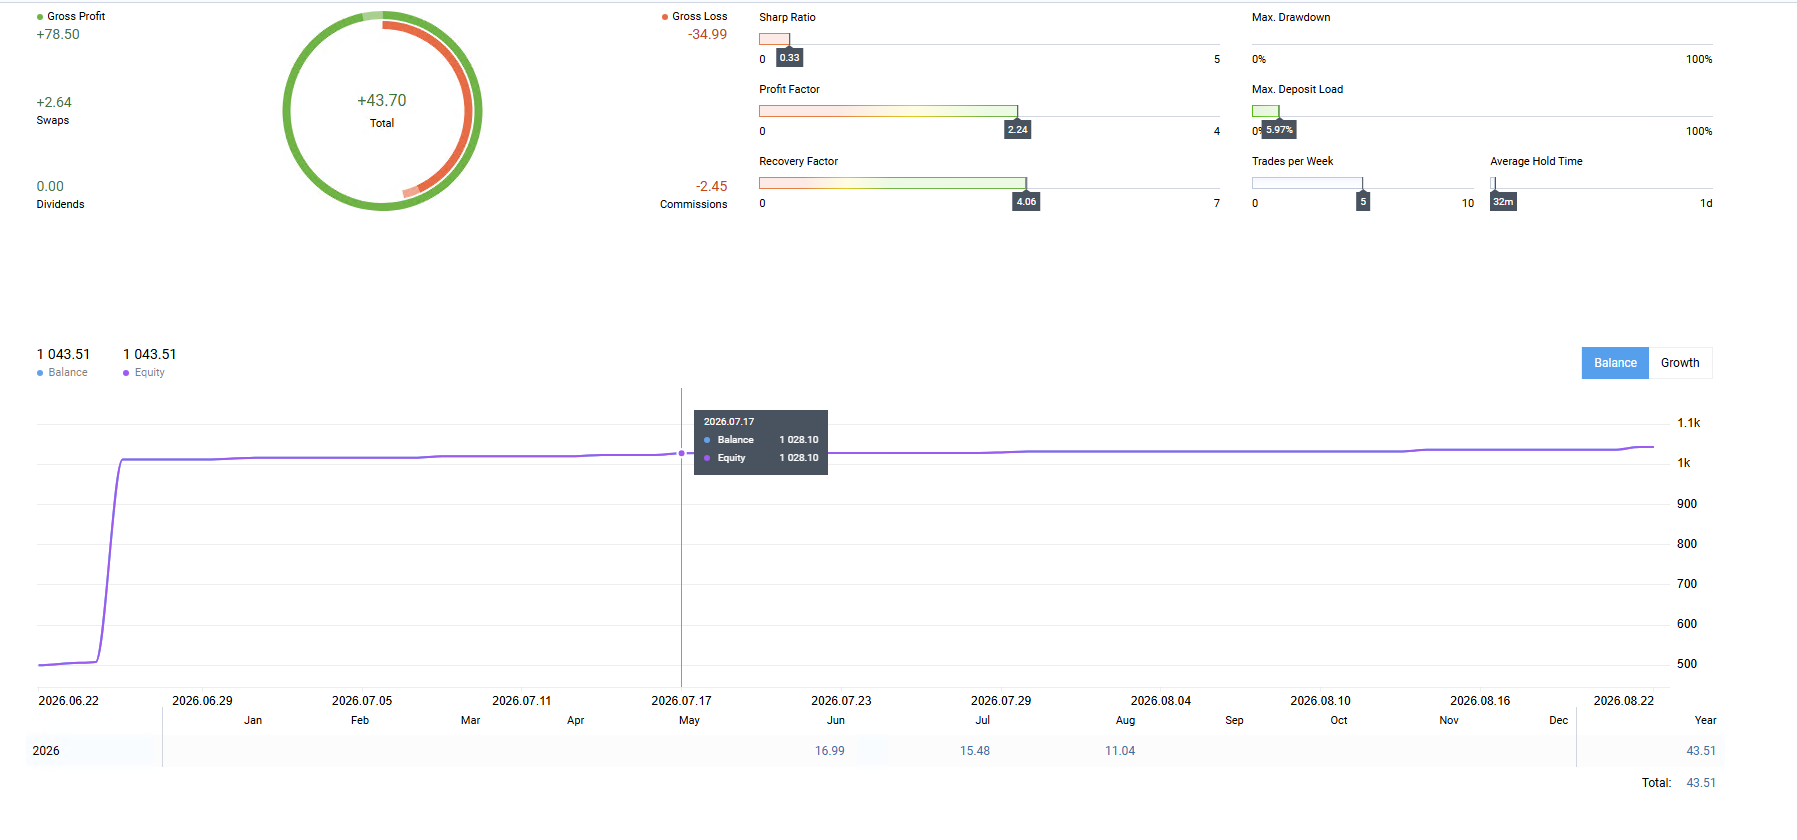
Nine weeks live, 22 June onward. Figures below.
| Metric | Live (9 weeks) |
|---|---|
| Net result | +43.51 |
| Profit factor | 2.24 |
| Recovery Factor | 4.06 |
| Maximum drawdown) | 5.97% |
| Trades per week (overall) | ~5 |
| Average hold time | 32 minutes |
Why this matters more than the profit
A rising equity curve in a friendly market proves very little. Any number of systems look good while the trend cooperates. The real question is what happens when the trend turns against the position a system is inclined to take — and the honest answer for most grid-adjacent approaches is: that is exactly when they get hurt.
This one did not get hurt, because it refused to force trades through the ambiguity. Standing aside for weeks is not exciting. It is not a screenshot anyone shares. But it is the single most important thing I have observed live so far, and it is the behaviour I built the system around.
The plan
We are slightly behind the original timeline, and that was a choice — I wanted to live through this trend change before moving toward release, rather than launch and hope it held up. It held up. So the schedule cost was worth it.
The target now is a September launch.
Two things remain before then:
- More live testing. The observation continues, unchanged and un-tuned, right through to release.
- A name. The system still needs its final one. That is the last open piece — and, I will admit, not the easiest one.
More to follow as the live data grows.
No system is risk-free. Live samples remain limited. Past performance does not guarantee future results.