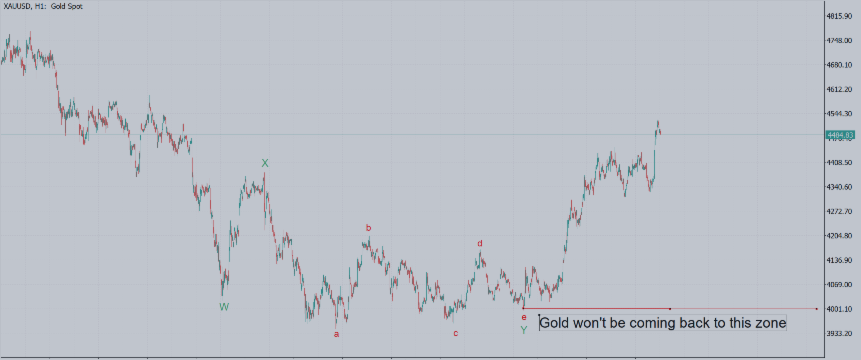

Gold (XAUUSD) on the H1 chart appears to have completed a complex W–X–Y correction near the important 4,000 price zone.
W–X–Y Structure
The initial decline formed wave W, followed by a corrective recovery in wave X. From the wave X high, wave Y appears to have developed as an a–b–c–d–e contracting triangle.
Wave e and the larger wave Y appear to have terminated near the 4,000 area. The strong upward movement following wave e supports the interpretation that the triangle and the complete corrective structure have ended.
Why the 4,000 Zone Is Important
This area represents the apparent termination of both wave e and wave Y. Price moved away from it with strong momentum and subsequently reclaimed several previous swing levels.
Under the primary Elliott Wave count, I do not presently expect Gold to make a complete return to this zone. However, this is a probability-based interpretation—not a certainty.
Invalidation and Reassessment
A sustained move below the wave Y low and acceptance beneath the marked support area would weaken this bullish interpretation. If that happens, the wave count should be reassessed instead of defended.
The purpose of this analysis is to study market structure and the behaviour of price after a possible terminal triangle.
Do you consider the strong post-triangle advance sufficient confirmation, or would you still wait for a deeper retest?
Original MQL5 chart:
https://www.mql5.com/en/charts/22100650/xauusd-h1-hf-markets-sv-gold-appears-to-have-completed-a
This is an educational Elliott Wave scenario and not financial advice.